Gold continues to attract demand as a safe-haven asset amid ongoing global political tensions. Institutional traders have increased their net long positions by approximately 1,000 contracts, signaling growing confidence in the bullish outlook.
On Friday, Gold printed a new Higher High, surpassing last week's peak — a technical sign of continued upward momentum. This price action, combined with increased institutional interest, suggests that a move toward the $3,420 level is within reach.
That said, I remain cautiously optimistic. There's still a risk of a short-term pullback, especially to fill the nearby gap left behind during last week’s price acceleration. Any retracement may offer another opportunity to buy at a discount.
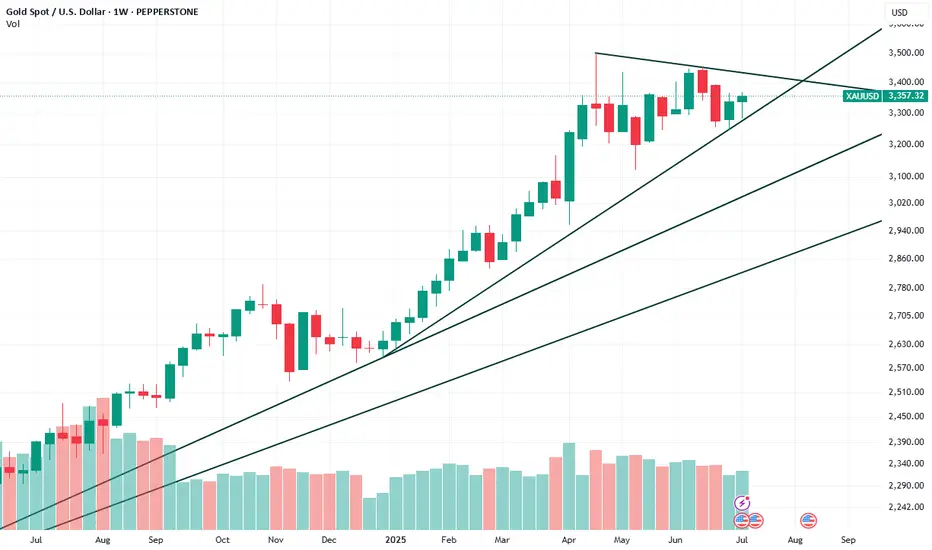
Chart Breakdown (Weekly – XAU/USD)
Symmetrical Triangle Forming:
Gold is consolidating within a tight triangle, with higher lows and lower highs converging.
A breakout above the upper trendline (~$3,420 zone) could trigger a new leg upward.
Volume Analysis:
Volume remains steady but not explosive — indicating consolidation, not reversal.
Watch for a volume spike on breakout to confirm the move.
Trendline Support Holding:
Price is respecting the rising trendline from December 2023.
As long as this line holds (~$3,300), the bullish structure remains intact.
Upside Targets:
Breakout above $3,420 could open room toward $3,500+.
A failure to break may lead to a retest of the support near $3,280–$3,300.
Bearish Scenario:
If the triangle breaks to the downside, price may revisit $3,100–$3,180 to fill the gap.
On Friday, Gold printed a new Higher High, surpassing last week's peak — a technical sign of continued upward momentum. This price action, combined with increased institutional interest, suggests that a move toward the $3,420 level is within reach.
That said, I remain cautiously optimistic. There's still a risk of a short-term pullback, especially to fill the nearby gap left behind during last week’s price acceleration. Any retracement may offer another opportunity to buy at a discount.
Chart Breakdown (Weekly – XAU/USD)
Symmetrical Triangle Forming:
Gold is consolidating within a tight triangle, with higher lows and lower highs converging.
A breakout above the upper trendline (~$3,420 zone) could trigger a new leg upward.
Volume Analysis:
Volume remains steady but not explosive — indicating consolidation, not reversal.
Watch for a volume spike on breakout to confirm the move.
Trendline Support Holding:
Price is respecting the rising trendline from December 2023.
As long as this line holds (~$3,300), the bullish structure remains intact.
Upside Targets:
Breakout above $3,420 could open room toward $3,500+.
A failure to break may lead to a retest of the support near $3,280–$3,300.
Bearish Scenario:
If the triangle breaks to the downside, price may revisit $3,100–$3,180 to fill the gap.
Disclaimer
The information and publications are not meant to be, and do not constitute, financial, investment, trading, or other types of advice or recommendations supplied or endorsed by TradingView. Read more in the Terms of Use.
Disclaimer
The information and publications are not meant to be, and do not constitute, financial, investment, trading, or other types of advice or recommendations supplied or endorsed by TradingView. Read more in the Terms of Use.