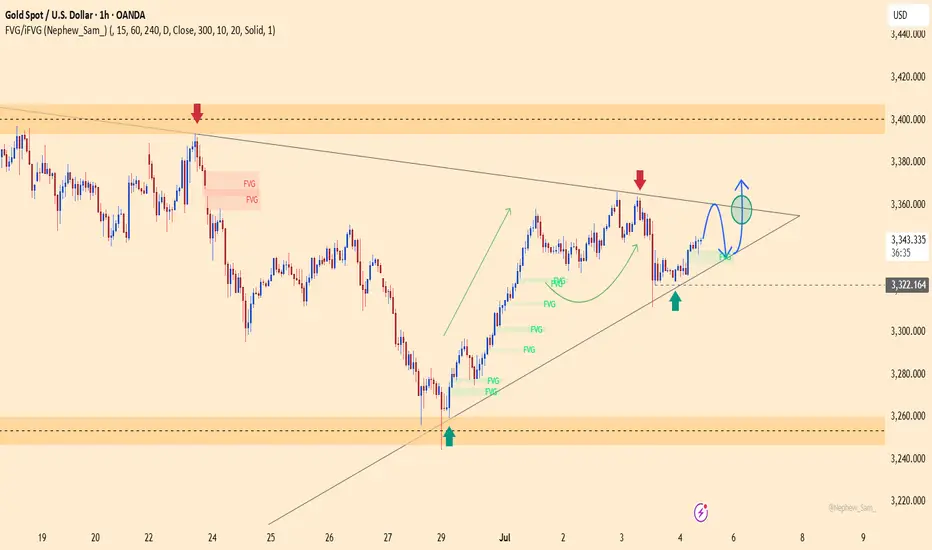
The H1 chart shows gold moving sideways within a symmetrical triangle, with higher lows and narrowing range — a classic sign of consolidation before a potential breakout.
The lower boundary of the triangle is acting as dynamic support around the 3,334–3,336 zone. Buyers appear to be in control, pushing price up from previous Fair Value Gap zones. If price holds above 3,334 and breaks through the upper triangle resistance, the next short-term target is around 3,371.
Strategy: Favor a mild upside breakout scenario. Consider long entries if price breaks above 3,350 with volume confirmation, targeting 3,371 for take-profit.
Top trading opportunities are waiting for you! : t.me/+TaRRH29IRysyNGJl
🔥 High-quality signals – Win rate up to 85%
📍 Accurate, verified technical analysis
⚡ Fast updates – Never miss a golden entry
🔥 High-quality signals – Win rate up to 85%
📍 Accurate, verified technical analysis
⚡ Fast updates – Never miss a golden entry
Related publications
Disclaimer
The information and publications are not meant to be, and do not constitute, financial, investment, trading, or other types of advice or recommendations supplied or endorsed by TradingView. Read more in the Terms of Use.
