[Core trading logic]
Daily level triangle convergence
The price forms a symmetrical triangle at 3180-3320, and is currently in the final consolidation (a direction must be determined within 3-5 trading days)
MACD key signal: The fast and slow lines are glued below the zero axis. If a golden cross appears, it will confirm the daily level rebound
Volume observation: The recent decline has shrunk significantly, which is in line with the characteristics of "main force accumulation"
4-hour cycle order flow analysis
Institutional cost area: 3220-3230 (the largest trading volume area in the past 2 weeks)
Key pressure levels:
First pressure 3285 (20EMA+Fibonacci 38.2%)
Core pressure 3308 (previous high neckline + channel upper rail)
Breakthrough validity standard: 2 consecutive 4-hour K-lines close firmly at 3300, and the trading volume ≥ 120% of the daily average volume
1-hour chart short-term rhythm
Asian market rules: There have been 5 times in the past 7 days 3250-3270 forms the intraday high and low points
European market momentum: If it breaks through 3275, the success rate of long positions before the US market will reach 68%
[Today's practical strategy]
Scenario 1: Oscillating upward (probability 65%)
Bull entry point:
Conservative: Go long after stepping back to 3248-3253 (15-minute Bollinger lower track), stop loss 3238, target 3275→3290
Aggressive: After breaking through 3278, step back to 3268 to chase long positions, stop loss 3258, target 3300
Key verification:
If 3280 is not broken before the US market, reduce the position by 50% to lock in profits
Scenario 2: False breakthrough reversal (probability =25% probability)
Short opportunities:
Place short orders when the price reaches 3305-3310 for the first time (stop loss 3318), target 3280→3260
If the price shows "long upper shadow + MACD top divergence" near 3290, enter the market with a short order immediately
Stop loss discipline:
All short order stop losses must be set above 3320
Scenario 3: Black swan decline (probability 10%)
Emergency plan:
After falling below 3230, short at 3245, stop loss 3260, target 3200→3180
If it reaches 3180 (the lower track of the daily line), close the short position and reverse the layout of the mid-line long position
Trade active
Technical analysis of gold:
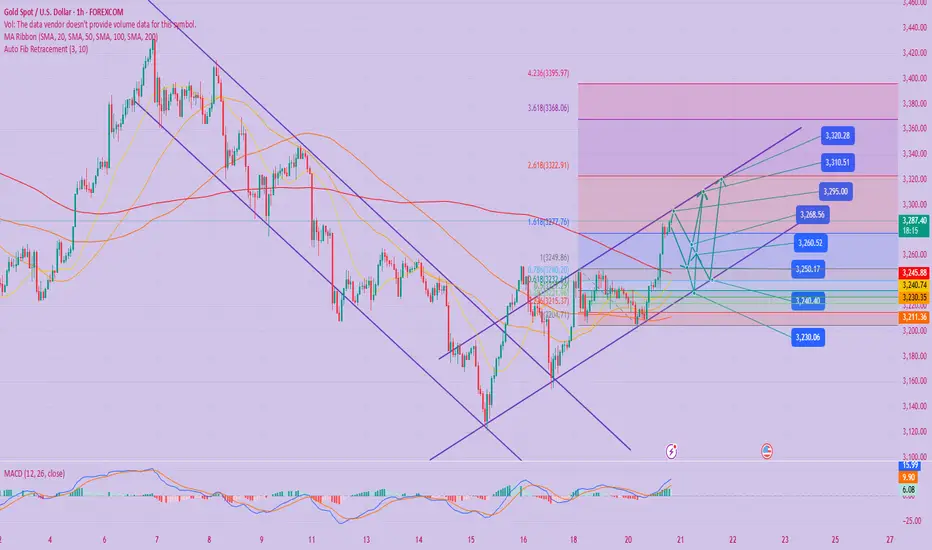
From a technical perspective, gold has performed strongly recently. Spot gold closed at $3,289.54 per ounce on Tuesday, and broke through $3,300 in early Asian trading on Wednesday, hitting a one-week high of $3,304.06. In the short term, gold prices need to break through the key resistance level of $3,370 to open up upward space, while $3,150 below has formed a solid support. If geopolitical or economic data add variables, gold prices may even challenge the $3,400 mark. Since there is now a breakout and upward movement, the trading idea is clear. The previous suppression level of 3,253 can be treated as a support, and long orders can be entered after the decline.
The current market of gold at the 4-hour level has gone out of a strong pattern. The Bollinger Bands continue to open upward, the moving average golden cross diverges upward, the MACD golden cross emerges, and the energy column continues to increase, suggesting that gold will continue to rise in the short term. Therefore, the bullish idea is maintained during the day. However, the current K-line has run above the upper track, which is not conducive to the continued rise of gold. Therefore, there are many key support levels to be stepped back in operation. The current short-term long support is 3273, and the previous top and bottom conversion position of 3265-3252 is concerned. Today's price falls back to two supports and continues to be long. The upper side is expected to reach 3325, and the break of 3347 is expected to rush to the 3400 line.
Now on the hourly level, from the low of 3120 to the low of 3155 last Friday and 3206 this week, an upward trend line can be constructed. At present, the gold price has broken through the 3300 mark and fell back. At the opening of the European session, the gold price continued to rise and broke through the high of 3315 in the early trading, and the highest was 3320. Although the price of gold is on the rise, the strength is not as strong as yesterday's unilateral rise. There are signs of one rise and three pullbacks. We need to be wary of the long-short conversion signal.
On the whole, today's short-term operation strategy for gold is to focus on buying at low levels and shorting at high levels as an auxiliary operation strategy.The short-term focus on the upper side is the 3330-3340 line of resistance, and the short-term focus on the lower side is the 3295-3285 line of support
Related publications
Disclaimer
The information and publications are not meant to be, and do not constitute, financial, investment, trading, or other types of advice or recommendations supplied or endorsed by TradingView. Read more in the Terms of Use.
Related publications
Disclaimer
The information and publications are not meant to be, and do not constitute, financial, investment, trading, or other types of advice or recommendations supplied or endorsed by TradingView. Read more in the Terms of Use.