🟡 Gold Daily Time Frame Analysis
🔍 Market Structure Overview
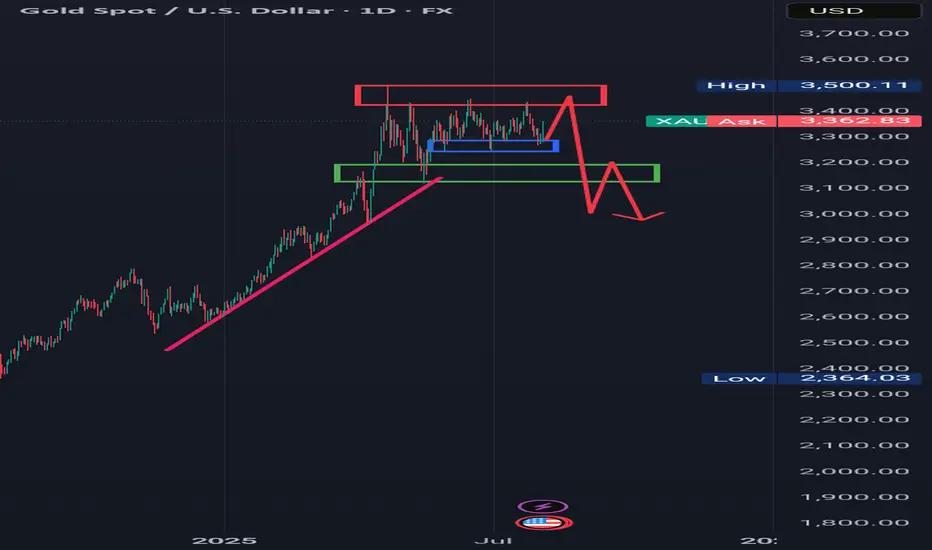
Gold has been consolidating in a broad range near its all-time highs, indicating a bullish exhaustion. This prolonged sideways movement is characteristic of a distribution phase, often preceding a potential trend reversal.
The current price action lacks strong directional momentum, as buyers appear exhausted near record highs.
The distribution pattern implies that institutions may be preparing to offload long positions and potentially build short positions for a future bearish move.
---
🟥 Red Rectangle – Resistance Zone (Potential Distribution Area)
Price has repeatedly tested this zone without a successful breakout.
This zone likely contains heavy sell-side liquidity and institutional supply.
Key Resistance Levels within this zone:
$3,400
$3,425
$3,480
This repeated failure to break higher reinforces the possibility of a trend reversal from this area.
---
🟦 Blue Rectangle – Minor Support (Liquidity Engineered Zone)
Gold is reacting to this minor support zone, showing temporary buying interest.
This may indicate that institutions are building liquidity, luring in buyers to drive price back toward the red zone.
Once sufficient liquidity is accumulated, smart money may offload remaining long positions into resistance, and initiate a bearish trend.
Key Support Levels:
$3,300 – immediate minor support
$3,200
$3,100
$3,000 – major psychological and technical support
---
📈 Institutional Price Behavior
This price behavior aligns with Wyckoff Distribution Theory, where:
Price consolidates near the top
Demand weakens
Institutions offload to late buyers
Downtrend begins after liquidity sweep or Upthrust (UTAD)
---
🧠 Conclusion
Gold’s ranging structure near ATH suggests we may be in a distribution phase. The reaction to the minor support implies a liquidity-building move to draw price back to resistance before a potential markdown phase (bearish trend) begins.
🔍 Market Structure Overview
Gold has been consolidating in a broad range near its all-time highs, indicating a bullish exhaustion. This prolonged sideways movement is characteristic of a distribution phase, often preceding a potential trend reversal.
The current price action lacks strong directional momentum, as buyers appear exhausted near record highs.
The distribution pattern implies that institutions may be preparing to offload long positions and potentially build short positions for a future bearish move.
---
🟥 Red Rectangle – Resistance Zone (Potential Distribution Area)
Price has repeatedly tested this zone without a successful breakout.
This zone likely contains heavy sell-side liquidity and institutional supply.
Key Resistance Levels within this zone:
$3,400
$3,425
$3,480
This repeated failure to break higher reinforces the possibility of a trend reversal from this area.
---
🟦 Blue Rectangle – Minor Support (Liquidity Engineered Zone)
Gold is reacting to this minor support zone, showing temporary buying interest.
This may indicate that institutions are building liquidity, luring in buyers to drive price back toward the red zone.
Once sufficient liquidity is accumulated, smart money may offload remaining long positions into resistance, and initiate a bearish trend.
Key Support Levels:
$3,300 – immediate minor support
$3,200
$3,100
$3,000 – major psychological and technical support
---
📈 Institutional Price Behavior
This price behavior aligns with Wyckoff Distribution Theory, where:
Price consolidates near the top
Demand weakens
Institutions offload to late buyers
Downtrend begins after liquidity sweep or Upthrust (UTAD)
---
🧠 Conclusion
Gold’s ranging structure near ATH suggests we may be in a distribution phase. The reaction to the minor support implies a liquidity-building move to draw price back to resistance before a potential markdown phase (bearish trend) begins.
Disclaimer
The information and publications are not meant to be, and do not constitute, financial, investment, trading, or other types of advice or recommendations supplied or endorsed by TradingView. Read more in the Terms of Use.
Disclaimer
The information and publications are not meant to be, and do not constitute, financial, investment, trading, or other types of advice or recommendations supplied or endorsed by TradingView. Read more in the Terms of Use.