Beyond the Headlines: Gold's Ascent Amidst Global Shifts & Key Technicals 🌐🚀
Everything about the last week can be found here: https://tradingview.sweetlogin.com/chart/XAUUSD/p6UDZ6MI-Turbulent-Week-Ahead-Gold-Outlook-June-9-13-2025/
 XAUUSD 💰📈
We all know what's going on, I believe. Israel struck Iran 💥, and this conflict will likely take a bit before things cool down. 🥶
---
## Geopolitical News Landscape 🌍📰
---
## Technical View 📐📈
### Market Structure:
Gold shows a clear **bullish market structure** with higher highs and higher lows. ⬆️ Recent price action suggests we're in a strong uptrend with institutional buying pressure. 🏦
### Key Levels:
* The chart shows a significant low around the **$3,245 area** (marked as "Low") which could act as a key institutional support level. 💪
* The current high near **$3,446** represents a potential institutional resistance zone. 🛑
* Look for potential **order blocks** around the **$3,380-$3,400 range** where price consolidated before the recent breakout. 🧱
### Fair Value Gaps (FVG):
There appear to be several gaps in the price action during volatile moves, particularly during strong rally phases. These could act as future support/resistance areas. 📉📈
### Gann Analysis:
The price movement shows strong adherence to Gann principles:
* The rally from the low follows a steep angle, suggesting strong momentum. 🚀
* Key Gann angles would place support around the **$3,300-$3,320 zone**. 📐
* The current price near **$3,436** is testing natural resistance levels based on Gann square calculations. 📏
### Fibonacci Levels:
From the significant swing low to the current high:
* 23.6% retracement: ~$3,395 📉
* 38.2% retracement: ~$3,370 📉
* 50% retracement: ~$3,345 📉
* 61.8% retracement: ~$3,320 📉
The golden ratio levels suggest key support on any pullback would be around the **$3,370-$3,345 zone**. ✨
### Institutional Levels:
* **Weekly/Monthly Levels:** The **$3,400** and **$3,450** areas appear to be significant institutional levels based on round numbers and previous price action. 🏦💰
* **Smart Money:** The accumulation pattern before the breakout suggests institutional participation. 🧠💡
### Cycle Timing:
Based on the timeframe (appears to be 30-minute bars from May 26-June 15):
* We're seeing approximately **3-week cycles** in the major moves. 🗓️
* The current rally phase appears to be in its mature stage. 🌳
* The next potential cycle turn could be approaching, suggesting caution for new longs at current levels. ⚠️
---
### Trading Considerations:
* Watch for rejection at current levels near **$3,446**. 📉
* Key support confluence around **$3,370-$3,345** for potential re-entry. 🎯
* Volume and momentum divergences would be critical for timing any reversal. 📊🔄
Other indicators tend to show bullish scenario enhancements. 🚀
Gold has formed a **Standard Bullish Flag pattern** over a time from early April till today. 🚩🐂

Also, the structure of a **reverse Head & Shoulders** is existing and has broken the neckline! 🔄🗣️

Another indicator is an existing "**Ascending Bull Flag**." ⬆️🚩

Please take the time to let me know what you think about this. 💬
-------------------------------------------------------------------------
This is just my personal market idea and not financial advice! 📢 Trading gold and other financial instruments carries risks – only invest what you can afford to lose. Always do your own analysis, use solid risk management, and trade responsibly.
Good luck and safe trading! 🚀📊
Everything about the last week can be found here: https://tradingview.sweetlogin.com/chart/XAUUSD/p6UDZ6MI-Turbulent-Week-Ahead-Gold-Outlook-June-9-13-2025/
We all know what's going on, I believe. Israel struck Iran 💥, and this conflict will likely take a bit before things cool down. 🥶
---
## Geopolitical News Landscape 🌍📰
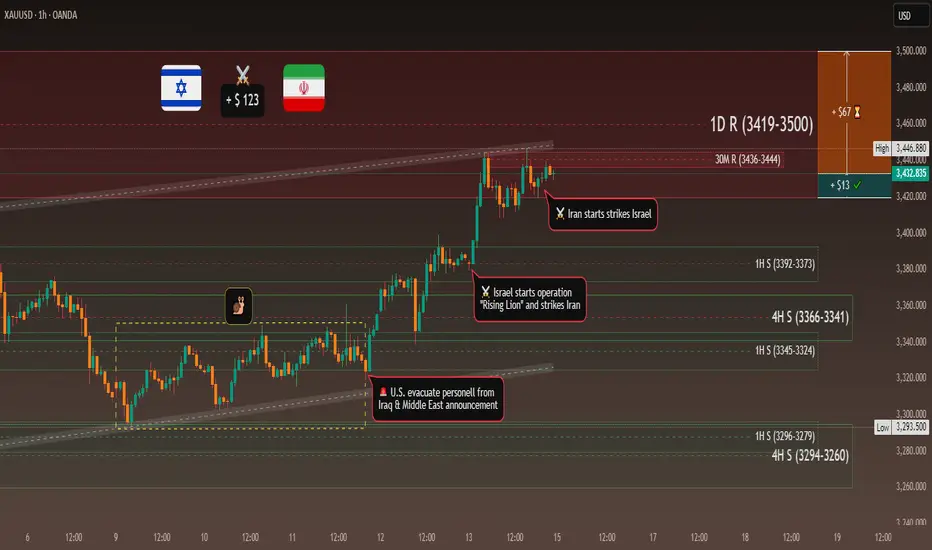
### Israel / Iran
Since June 12, Israel launched "Operation Rising Lion," targeting Iranian nuclear sites like Natanz and Esfahan – over 128 killed, Iran claims. 🇮🇷 retaliated with missile and drone strikes on Haifa and Tel Aviv, killing at least 10. 🚀
**Outlook:** 🔥 Tensions are spiraling. Without urgent mediation, full-scale regional war remains a real risk. 💣
### India / Pakistan
Since the May ceasefire, few clashes have occurred. However, both navies increased readiness, signaling potential escalation at sea. 🚢
**Outlook:** ⚖️ Peace is fragile. A strategic dialogue is key to avoiding a renewed border or maritime conflict. 🙏
### Gaza Conflict
Between June 7–15, Israeli strikes killed at least 41 Palestinians, including 8 near an aid center in Rafah. Over 55,000 total deaths, and famine is looming. 💔
**Outlook:** 🆘 Gaza remains a humanitarian catastrophe. Global pressure for access and a ceasefire must intensify. 🕊️
### Russia / Ukraine
June 13–15: Russia returned the bodies of 1,200 Ukrainian soldiers in a rare POW swap gesture. 🤝 Fighting remains intense in Sumy and Toretsk; Russia hit a major oil refinery. 🏭
**Outlook:** 🕊️ While symbolic moves continue, no peace is in sight – battlefield outcomes will shape diplomacy. ⚔️
### U.S. - China Trade War
The U.S. hiked tariffs to 55% on key Chinese goods. 🇺🇸🇨🇳 responded with 10% on U.S. imports. Talks yielded a partial truce, but military-use rare earths remain unresolved. 💻
**Outlook:** 🔧 Tech remains the battleground. Without progress on critical materials, the trade war may deepen. 📉
### Global Trade War
The OECD revised global growth downward due to rising tariffs from the U.S. targeting 🇨🇳, 🇲🇽, 🇨🇦. Global trade volume is expected to shrink by 0.2–1.5%. 📉
**Outlook:** ⛓️ Supply chain disruption is spreading. Global trade will stay under pressure without coordinated policy. 🌍➡️🌍
### Trump vs. Powell
Trump labeled Powell a "numbskull" for not cutting rates, suggesting he might "force something" if re-elected. 🗳️ The Fed maintains policy independence ahead of a critical June decision. 🏛️
**Outlook:** ⚔️ Political pressure on the Fed is mounting. Expect more friction as the election cycle heats up. 🔥
### U.S. Inflation
CPI rose 2.4% YoY in May (from 2.3%); Core CPI held steady at 2.8%. Monthly growth was modest at 0.1%. Key rises were seen in healthcare and vehicle prices. 🚗🏥
**Outlook:** Inflation is stable but sticky. 🚦 The Fed will likely hold rates steady until clearer disinflation signals appear. 📊
---
## Technical View 📐📈
### Market Structure:
Gold shows a clear **bullish market structure** with higher highs and higher lows. ⬆️ Recent price action suggests we're in a strong uptrend with institutional buying pressure. 🏦
### Key Levels:
* The chart shows a significant low around the **$3,245 area** (marked as "Low") which could act as a key institutional support level. 💪
* The current high near **$3,446** represents a potential institutional resistance zone. 🛑
* Look for potential **order blocks** around the **$3,380-$3,400 range** where price consolidated before the recent breakout. 🧱
### Fair Value Gaps (FVG):
There appear to be several gaps in the price action during volatile moves, particularly during strong rally phases. These could act as future support/resistance areas. 📉📈
### Gann Analysis:
The price movement shows strong adherence to Gann principles:
* The rally from the low follows a steep angle, suggesting strong momentum. 🚀
* Key Gann angles would place support around the **$3,300-$3,320 zone**. 📐
* The current price near **$3,436** is testing natural resistance levels based on Gann square calculations. 📏
### Fibonacci Levels:
From the significant swing low to the current high:
* 23.6% retracement: ~$3,395 📉
* 38.2% retracement: ~$3,370 📉
* 50% retracement: ~$3,345 📉
* 61.8% retracement: ~$3,320 📉
The golden ratio levels suggest key support on any pullback would be around the **$3,370-$3,345 zone**. ✨
### Institutional Levels:
* **Weekly/Monthly Levels:** The **$3,400** and **$3,450** areas appear to be significant institutional levels based on round numbers and previous price action. 🏦💰
* **Smart Money:** The accumulation pattern before the breakout suggests institutional participation. 🧠💡
### Cycle Timing:
Based on the timeframe (appears to be 30-minute bars from May 26-June 15):
* We're seeing approximately **3-week cycles** in the major moves. 🗓️
* The current rally phase appears to be in its mature stage. 🌳
* The next potential cycle turn could be approaching, suggesting caution for new longs at current levels. ⚠️
---
### Trading Considerations:
* Watch for rejection at current levels near **$3,446**. 📉
* Key support confluence around **$3,370-$3,345** for potential re-entry. 🎯
* Volume and momentum divergences would be critical for timing any reversal. 📊🔄
Other indicators tend to show bullish scenario enhancements. 🚀
Gold has formed a **Standard Bullish Flag pattern** over a time from early April till today. 🚩🐂
Also, the structure of a **reverse Head & Shoulders** is existing and has broken the neckline! 🔄🗣️
Another indicator is an existing "**Ascending Bull Flag**." ⬆️🚩
Please take the time to let me know what you think about this. 💬
-------------------------------------------------------------------------
This is just my personal market idea and not financial advice! 📢 Trading gold and other financial instruments carries risks – only invest what you can afford to lose. Always do your own analysis, use solid risk management, and trade responsibly.
Good luck and safe trading! 🚀📊
Note
Monday: Bull Flag failed and gold tumbled down the stairs ends at $ 3385 - $ 69.Why? Is safe heaven not longer needed? Is the conflict between Israel and Iran not enough to push the price further?
Gold tumbled by approximately $69 on June 16, 2025, ending at $3385. 📉 This significant drop raises questions about why safe-haven demand, typically seen for gold amidst geopolitical tensions like the Israel-Iran conflict, seemingly diminished. 🕊️
The decline is likely due to a combination of factors. Firstly, gold was "overbought" after its recent rally, triggering profit-taking. 💰 Secondly, signs of easing in other global tensions (e.g., trade) or improved economic data might have led investors to shift from safe havens to riskier assets. 📈 Anticipated rising interest rates could also make gold less attractive, as it yields no interest. 🏦
Furthermore, much of the geopolitical risk might have already been priced into gold. While conflicts initially cause surges, the sustained impact depends on actual escalation and economic consequences. 💥 Ultimately, the price fall reflected a complex interplay of profit-taking, shifting market sentiment, and macroeconomic factors that temporarily outweighed safe-haven demand. 🤔
Note
Update: Gold's Holding Pattern Amidst Geopolitical Tensions 📉⏳Tuesday was a remarkably quiet day for gold. 😴 The price range was a tight $49, fluctuating between a peak of **$3403** 📈 and a low of **$3366** 📉. Gold is clearly poised for a decisive move, and so are traders. 🧐 However, throughout the daily sessions, geopolitical news kept the price in a holding pattern, preventing any significant rise or fall. 🤷♀️ We closed yesterday at **$3385**, and today we ended at **$3388**. It seems market makers were once again "hovering the grass" and shaking out the "dumb money." 🌾💸
Different trading sessions painted a consistent picture: the market is closely watching the situation in the Middle East. 👀 Everyone seems to be waiting for the USA to actively step into the conflict between Israel and Iran. Over the day, **unconfirmed news** surfaced about the U.S. providing bunker-buster bombs to Israel. 💣🤫
A national security meeting took place at **1 PM EDT** 🏛️, but details on its outcome remain scarce. My personal expectation is that the U.S. might be preparing to conclude what Israel has started. Hopefully, there's no further escalation and that this conflict finds a swift resolution. 🙏🕊️
On the technical front, the large **inverse Head & Shoulders pattern** visible on the 4-hour chart has now been **invalidated** ❌📉 since the price returned below its neckline entry. There's also no way to resume this pattern, even with a deeper left shoulder, because the breakout from the neckline was higher than the right shoulder's start, which further invalidates the pattern. 💔
Tomorrow could prove to be more interesting, as I believe more news regarding the conflict will emerge in the coming hours. Stay tuned! ⏰📰
Note
Of course $ 37 Range from $ 3403 and a low of $ 3366, math is hard :-)Disclaimer
The information and publications are not meant to be, and do not constitute, financial, investment, trading, or other types of advice or recommendations supplied or endorsed by TradingView. Read more in the Terms of Use.
Disclaimer
The information and publications are not meant to be, and do not constitute, financial, investment, trading, or other types of advice or recommendations supplied or endorsed by TradingView. Read more in the Terms of Use.