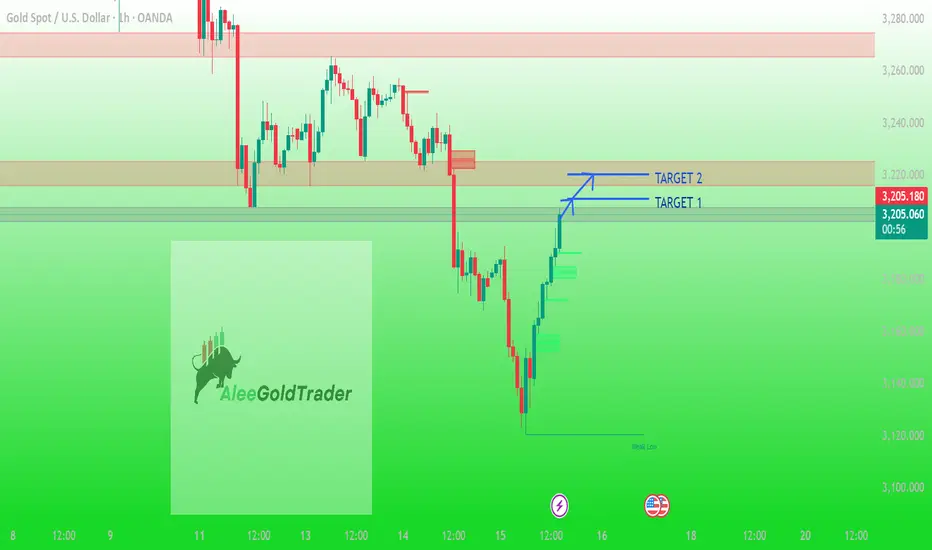
This 1-hour chart of Gold Spot (XAU/USD) from OANDA shows a strong bullish reversal following a recent sell-off. The price is approaching a key supply zone, where two potential target levels are identified:
Target 1: ~3,210 USD
Target 2: ~3,220 USD
The chart highlights previous resistance zones and current price action suggesting momentum toward these targets. The bullish run follows a reversal from a "Weak Low" area near 3,115 USD. Zones are color-coded for supply/resistance (red) and demand/support (green). The setup indicates possible short-term buying opportunities as price tests previous consolidation zones.
Trade closed: target reached
Daily XAU/USD FREE setups | Let's grow together!
| XAU/USD Trader | Telegram: https://t.me/Aleegoldsignals
| XAU/USD Trader | Telegram: https://t.me/Aleegoldsignals
Disclaimer
The information and publications are not meant to be, and do not constitute, financial, investment, trading, or other types of advice or recommendations supplied or endorsed by TradingView. Read more in the Terms of Use.