📈 Chart Overview
Instrument: Likely XAU/USD (Gold vs USD)
Date: April 22, 2025
Timeframe: Appears to be a short-term chart (possibly 1H or 4H)
🧠 Key Technical Elements
1. Exponential Moving Averages (EMAs)
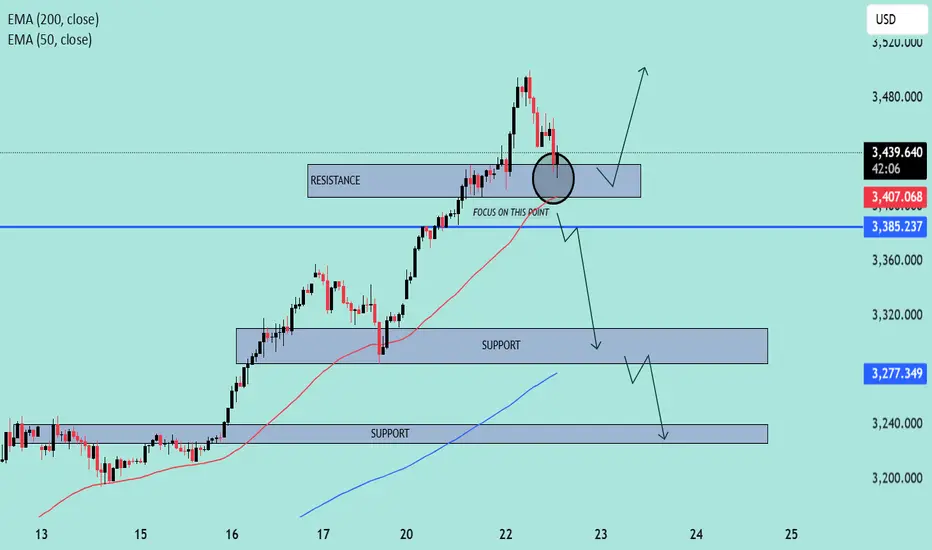
50 EMA (Red): Currently at 3,406.818 — acting as short-term dynamic support/resistance.
200 EMA (Blue): Currently at 3,277.286 — indicating long-term trend direction.
The price is well above the 200 EMA, indicating a bullish long-term trend. However, it’s now testing the 50 EMA, suggesting a potential short-term inflection point.
2. Support and Resistance Zones
Immediate Resistance Zone: Around 3,430 – 3,440, which price recently rejected.
Key Support Zone: Around 3,385 – 3,390 (labeled “FOCUS ON THIS POINT”), which aligns closely with the 50 EMA.
Lower Support Zones:
3,310 – 3,320
3,240 – 3,260
🔍 Technical Scenarios Outlined on Chart
✅ Bullish Scenario (Upper Arrow Path)
If the price holds above the 3,385 support zone, especially with support from the 50 EMA:
We may see a bounce back to test and potentially break above the 3,430 resistance.
This would confirm a continuation of the uptrend.
⚠️ Bearish Scenario (Lower Arrow Path)
If the price fails to hold above 3,385:
A breakdown may lead to a drop toward 3,320, with possible continuation toward 3,240.
This would indicate a short-term bearish correction within a longer bullish trend.
🔑 Critical Price Level
Focus on the 3,385 zone — This is a confluence area where:
Horizontal support meets
50 EMA is located
A potential decision point for bulls vs. bears
🧭 Trading Strategy Considerations
For Bulls:
Look for bullish candlestick formations or volume confirmation near the 3,385 level.
Target a retest of the 3,430+ area with stops below 3,375.
For Bears:
Watch for strong bearish breakdown below 3,385.
First target: 3,320, second: 3,240, with stop-loss above 3,400.
📌 Conclusion
The chart illustrates a key inflection point. Price is at a decision zone — hold and bounce = continuation of bullish momentum, break = short-term correction. All eyes on how price reacts at the 50 EMA and support zone near 3,385.
Instrument: Likely XAU/USD (Gold vs USD)
Date: April 22, 2025
Timeframe: Appears to be a short-term chart (possibly 1H or 4H)
🧠 Key Technical Elements
1. Exponential Moving Averages (EMAs)
50 EMA (Red): Currently at 3,406.818 — acting as short-term dynamic support/resistance.
200 EMA (Blue): Currently at 3,277.286 — indicating long-term trend direction.
The price is well above the 200 EMA, indicating a bullish long-term trend. However, it’s now testing the 50 EMA, suggesting a potential short-term inflection point.
2. Support and Resistance Zones
Immediate Resistance Zone: Around 3,430 – 3,440, which price recently rejected.
Key Support Zone: Around 3,385 – 3,390 (labeled “FOCUS ON THIS POINT”), which aligns closely with the 50 EMA.
Lower Support Zones:
3,310 – 3,320
3,240 – 3,260
🔍 Technical Scenarios Outlined on Chart
✅ Bullish Scenario (Upper Arrow Path)
If the price holds above the 3,385 support zone, especially with support from the 50 EMA:
We may see a bounce back to test and potentially break above the 3,430 resistance.
This would confirm a continuation of the uptrend.
⚠️ Bearish Scenario (Lower Arrow Path)
If the price fails to hold above 3,385:
A breakdown may lead to a drop toward 3,320, with possible continuation toward 3,240.
This would indicate a short-term bearish correction within a longer bullish trend.
🔑 Critical Price Level
Focus on the 3,385 zone — This is a confluence area where:
Horizontal support meets
50 EMA is located
A potential decision point for bulls vs. bears
🧭 Trading Strategy Considerations
For Bulls:
Look for bullish candlestick formations or volume confirmation near the 3,385 level.
Target a retest of the 3,430+ area with stops below 3,375.
For Bears:
Watch for strong bearish breakdown below 3,385.
First target: 3,320, second: 3,240, with stop-loss above 3,400.
📌 Conclusion
The chart illustrates a key inflection point. Price is at a decision zone — hold and bounce = continuation of bullish momentum, break = short-term correction. All eyes on how price reacts at the 50 EMA and support zone near 3,385.
Trade active
📉 Gold (XAU/USD) delivered a precise move, tapping into the key support zone at 3,317 — a level we've been closely monitoring. This reaction confirms the technical significance of the area.
🔍 Now, the focus shifts to what comes next:
Will bearish momentum continue and drive prices toward the final downside targets?
Or will we see a bullish pullback from this demand zone?
📊 The market is at a decision point. Price action around this level will offer valuable clues. Stay alert and manage positions accordingly. ⚖️
Trade closed: target reached
JOIN MY TELEGRAM CHANNEL
t.me/StellarMarketAnalysis
JOIN MY RECOMMENTED BROKER REFFREL LINK
⤵️one.exnesstrack.net/a/uvd1etcgg1
PARTNER CODE⤵️
uvd1etcgg1
t.me/StellarMarketAnalysis
JOIN MY RECOMMENTED BROKER REFFREL LINK
⤵️one.exnesstrack.net/a/uvd1etcgg1
PARTNER CODE⤵️
uvd1etcgg1
Disclaimer
The information and publications are not meant to be, and do not constitute, financial, investment, trading, or other types of advice or recommendations supplied or endorsed by TradingView. Read more in the Terms of Use.