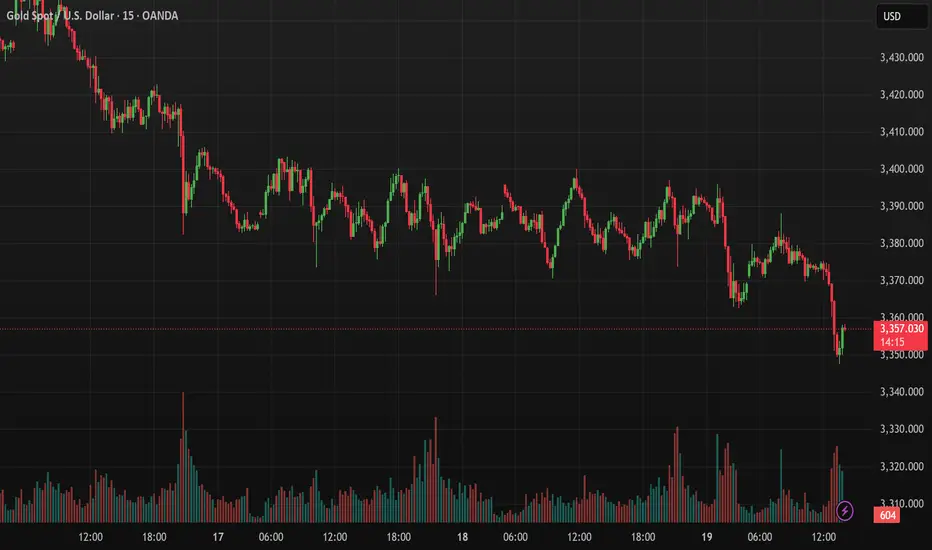
During the trading session on June 19, gold (XAUUSD) experienced significant volatility, breaking below the short-term support zone around 3,370 USD/oz and sharply dropping to an intraday low of approximately 3,350 USD/oz. This support level had been tested multiple times in previous sessions and has often led to price rebounds.
Following the sharp decline, buying pressure emerged, as shown by a strong reversal candlestick accompanied by a volume spike — indicating that buyers are stepping in at this attractive price zone.
Technical Breakdown – 15-Minute Chart
Chart type: XAUUSD, 15-minute timeframe
Support zone: 3,350 (tested and showing reaction)
Nearby resistance: 3,365 – 3,370
Volume: Surged at the bottom, suggesting buying interest.
Pattern: Signs of a temporary bottom (bullish pin bar + supporting volume).
Suggested Trading Strategy
Based on today’s price action and chart structure, consider:
Short-term buy around 3,351 – 3,353 with a stop loss below 3,348.
Take profit targets: 3,365 – 3,372.
Extended strategy: If EMA5 crosses up and locks above 3,370, extend targets to 3,388 – 3,395 during the US session.
Conclusion: 3,350 is Acting as the Final Support Wall
Today’s session shows that sellers are still in control, but technical reactions around 3,350 have formed a strong defense. If price continues to hold this level and volume remains positive, a short-term rebound is highly likely.
However, traders should manage positions with flexibility as the broader trend still leans bearish — only a break and hold above 3,370–3,380 could signal a clearer trend reversal.
🪙 JOIN OUR FREE TELEGRAM GROUP 🪙
t.me/dnaprofits
Join the community group to get support and share knowledge!
️🥇 Exchange and learn market knowledge
️🥇 Support free trading signals
t.me/dnaprofits
Join the community group to get support and share knowledge!
️🥇 Exchange and learn market knowledge
️🥇 Support free trading signals
Disclaimer
The information and publications are not meant to be, and do not constitute, financial, investment, trading, or other types of advice or recommendations supplied or endorsed by TradingView. Read more in the Terms of Use.