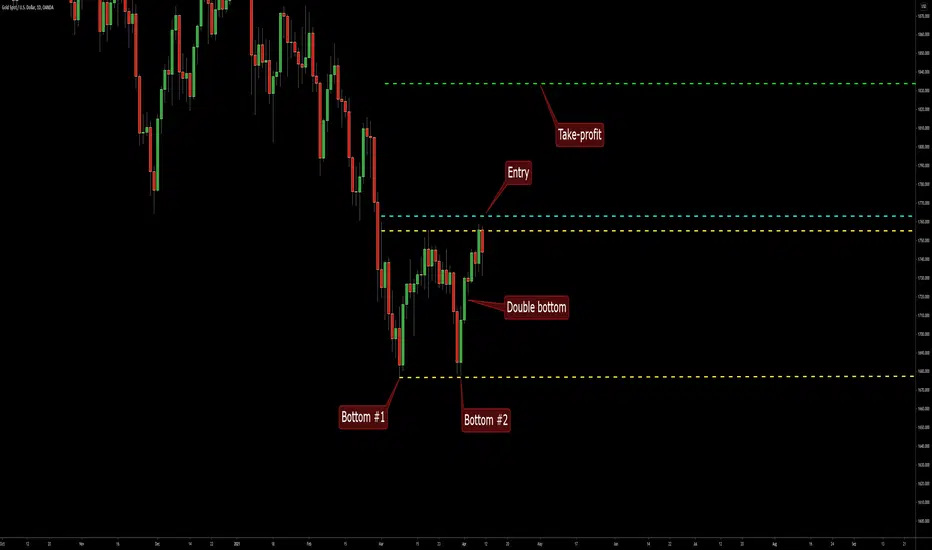
This double bottom pattern has formed on the daily chart of XAU/USD (Gold) and is ready for a breakout. The two bottoms are marked with the lower yellow line; the neckline is marked with the upper yellow line. My potential entry level is at the cyan line. My potential take-profit level is at the green line. Stop-loss can be set to the low of the breakout candle (not shown on the chart).
Trade active
Long entered today at 14:13 UTC at 1763.13 with SL = 1734.32 and TP = 1833.83.Trade closed: target reached
TP reached today at 12:34 UTC.You can find useful tools to detect, build, and trade chart patterns - all completely free on earnforex.com.
Disclaimer
The information and publications are not meant to be, and do not constitute, financial, investment, trading, or other types of advice or recommendations supplied or endorsed by TradingView. Read more in the Terms of Use.
You can find useful tools to detect, build, and trade chart patterns - all completely free on earnforex.com.
Disclaimer
The information and publications are not meant to be, and do not constitute, financial, investment, trading, or other types of advice or recommendations supplied or endorsed by TradingView. Read more in the Terms of Use.