Description:
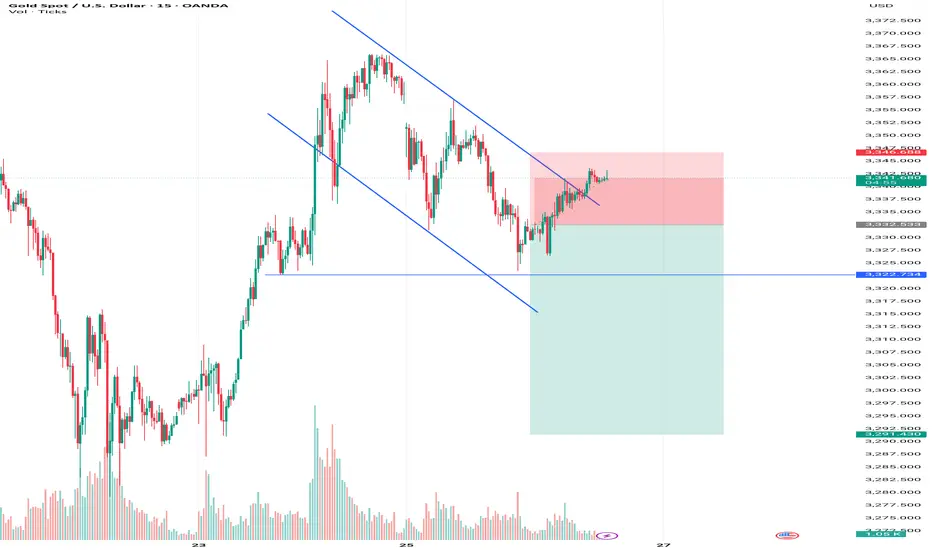
"This 15-minute chart of Gold Spot (XAUUSD) highlights recent intraday movements with strong volatility and a potential bullish recovery after testing the 3340 support area. The chart is intended for educational and analytical purposes, helping traders observe key zones and price behavior."
---
Let me know if you want to add trendlines, support/resistance levels, or labels on the chart before posting.
Trade active
trade active all its time to trade active Trade closed: target reached
Hold for 12 hoursDisclaimer
The information and publications are not meant to be, and do not constitute, financial, investment, trading, or other types of advice or recommendations supplied or endorsed by TradingView. Read more in the Terms of Use.
Disclaimer
The information and publications are not meant to be, and do not constitute, financial, investment, trading, or other types of advice or recommendations supplied or endorsed by TradingView. Read more in the Terms of Use.