I. Fundamental analysis
1. Global macro environment:
As a safe-haven asset, gold's price fluctuations are affected by multiple factors, including:
Macroeconomic policies (such as interest rates, inflation expectations)
Geopolitical tensions
Market risk sentiment and capital flows
2. The core factors currently affecting gold trends:
Federal Reserve interest rate decision:
The result of this interest rate decision is in line with market expectations;
But Powell delivered a hawkish speech after the meeting, suppressing the market's optimistic expectations for interest rate cuts this year;
As a result, the price of gold quickly fell from around $3,395 to around $3,362, showing a short-term negative effect;
Overall, the Fed's hawkish stance puts some pressure on gold.
Geopolitical risks (Middle East situation):
The conflict between Israel and Iran continues to escalate, and market risk aversion has increased;
It supports gold and limits its downside space.
Holiday impact:
The U.S. market closed early for the "Juneteenth" holiday;
Market trading volume is expected to shrink, and the volatility may be limited in the short term.
2. Technical analysis
1. Daily analysis:
Brief summary of gold trend this week:
Monday: A sharp drop after a high opening;
Tuesday: A cross positive line was closed, showing a shock correction;
Wednesday: The price of gold continued to fluctuate after the Fed's decision, and the lowest price of gold reached $3,362.
Analysis of key technical indicators and points:
Support level:
$3,362 is the low point of this decline;
This point coincides with the 10-day moving average (3,360), forming a strong support;
If this position is maintained, gold may maintain a volatile trend;
If it falls below, the next support is the 20-day moving average: around 3,350.
Resistance level:
The first resistance is the 5-day moving average: $3,390;
The stronger resistance above is at $3,405, which is a concentrated pressure point;
If it breaks through 3,405, it is expected to rise further to $3,430.
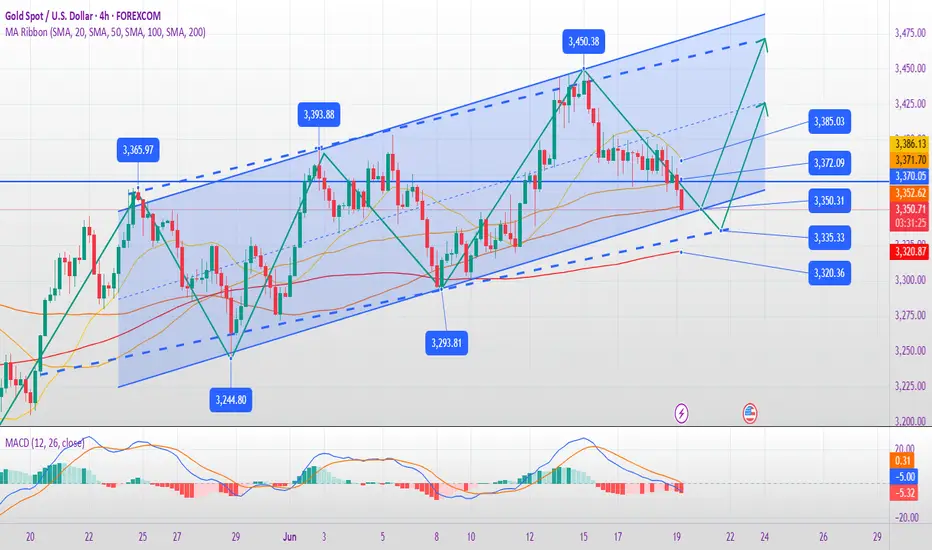
2. 4-hour chart analysis:
The current structure has not changed significantly:
The lower track of the Bollinger band has not opened, the support of 3360 is effective, and the structure is bullish;
But the continuous rebound has not broken through the pressure point of the middle track of the Bollinger band, indicating that the medium-term is still a weak and volatile pattern;
If the short-term gold price can break through the suppression level of 3405 US dollars, it is possible to start a new round of rise, with the target pointing to the high point of 3430 US dollars.
Intraday trading suggestions:
Maintain the "high-altitude and low-multiple" operation idea;
Wait for the price to appear a confirmation signal near the key support or resistance level before entering the market;
Currently, it is recommended to be bullish above the support level of 3360.
III. Operation strategy suggestions (short-term)
1. Short order strategy (high-altitude):
Entry range: 3385-3383 US dollars;
Stop loss: 3390 US dollars;
Target: 3370-3365 US dollars.
2. Long order strategy (low long):
Entry range: 3365-3367 USD;
Stop loss: 3359 USD;
Target: 3375-3385 USD.
IV. Summary
Gold is currently in a long-short game and a weak shock pattern;
The hawkish stance of the Federal Reserve suppresses gold, but geopolitical factors provide support for it;
From a technical perspective, 3360 is the key support point and 3405 is the key resistance point;
Short-term thinking is mainly based on shock thinking, and the operation is recommended to maintain the high-altitude low-multiple strategy in the range;
Follow-up focus:
Whether 3360 is effectively maintained;
Whether 3405 is successfully broken through to confirm the trend direction.
Trade active
Gold trend analysis and trading strategy:
Current market background
Monday: A sharp drop after a high opening, dominated by bears.
Tuesday: A cross-yang line oscillates and corrects, with long and short positions tug-of-war.
Wednesday: After the Fed's interest rate decision, it dropped to 3362 (10-day moving average support), then rebounded, and the overall volatility remained.
Key technical analysis
1. Daily level
Support level:
3350 (10-day moving average) - if it holds, the gold price will remain volatile; if it falls below, it may further drop to the 20-day moving average of 3330-3320.
3360 (4-hour lower track support) - short-term bullish defense position.
Resistance level:
3390 (5-day moving average suppression) - the first pressure of short-term rebound.
3405 (key break point) - after breaking through, the upward space may open up to 3430.
2. 4-hour level
The Bollinger Bands narrowed, indicating a volatile market. The 3360 support was strong, but the rebound failed to break through the middle track (about 3385), indicating that the bulls lacked momentum.
Key observation points:
If it stands at 3385 (middle track), it may test 3405.
If it falls below 3360, it may drop to the 3350-3340 support area.
Today's trading strategy (short-term)
1. High-altitude strategy (short on rebound)
Entry point: 3383-3385 (close to the 5-day moving average and the 4-hour middle track pressure)
Stop loss: above 3390 (to prevent false breakthroughs)
Target: 3370-3365 (look down at the 4-hour lower track support)
2. Low-long strategy (long on pullback)
Entry point: 3350-3352 (10-day moving average support)
Stop loss: below 3340 (to prevent a breakout and fall)
Target: 3375-3385 (middle track and daily moving average resistance)
3. Breakthrough strategy (trend following)
If it breaks through 3405: you can chase long with a light position, target 3430, stop loss 3395.
If it falls below 3340: it may accelerate downward, wait and see or short-term short.
Key points:
The impact of the Fed meeting is still being digested, beware of sudden changes in market sentiment.
Correlation with the US dollar trend: If the US dollar strengthens, gold may be under pressure.
Reduce frequent trading in volatile markets and wait for key points to be confirmed before operating.
❤️Free gold trading signals:t.me/+OJSbWQ6F4KM2Mzk1
💥Gold trading analyst | Technology + logic dual drive
💯Intraday/band strategy analysis | Risk control first, win in stability
💥Gold trading analyst | Technology + logic dual drive
💯Intraday/band strategy analysis | Risk control first, win in stability
Related publications
Disclaimer
The information and publications are not meant to be, and do not constitute, financial, investment, trading, or other types of advice or recommendations supplied or endorsed by TradingView. Read more in the Terms of Use.