Market news:
In the early Asian session on Friday (July 18), spot gold fluctuated in a narrow range and is currently trading around $3,336 per ounce. London gold prices staged a thrilling "deep V" market yesterday, hitting a daily low of $3,309 during the session and recovering to 3,339 at the end of the session. Strong US retail sales and employment data drove the dollar to rebound and US Treasury yields to rise, putting pressure on interest-free assets such as gold. Despite this, geopolitical tensions and rising tariff risks are still providing bottom support for the gold market. The international gold market is currently in a multi-game of Fed policies, US economic data, US dollar trends and tariff policies. The Fed's position of postponing interest rate cuts, strong retail and employment data, and the rise in the US dollar and US Treasury yields have suppressed gold prices in the short term. This trading day needs to pay attention to the preliminary value of the University of Michigan Consumer Confidence Index in July and US real estate market data, pay attention to the G20 Finance Ministers and Central Bank Governors Meeting hosted by South Africa, and pay attention to news related to the international trade situation.
Technical Review:
Gold closed with a small positive line with a long upper shadow yesterday. Although it ended the continuous negative trend, it still faced sideways resistance below 3374, and the overall market still needs to be treated as a shock consolidation. From a large cycle perspective, gold has entered a convergent triangle consolidation phase of nearly three months. Among them, the lower track support line gradually moved up to above 3310. The support strength of this position continues to increase as the consolidation time lengthens. If the price touches or approaches this point, you can decisively try to buy the bottom layout.For two consecutive trading days, gold has been consolidating in a larger range of 3377/3310, and finally closed at the starting point of the daily Bollinger band middle track at the end of the trading day. Gold returned to the middle axis of the range at 3340. The daily chart Bollinger band middle track, the RSI indicator middle axis flattened, the four-hour chart hourly chart Bollinger band middle track, and the RSI indicator neutral middle axis. On Friday, the layout of the day will still be based on a wide range of fluctuations. Look at the 3320/3360 range first. Alternating buying and selling cycles, large range of wide fluctuations!
Today's analysis:
In the past two days, gold has always risen in the US market due to news. Last night, Trump called on the Federal Reserve to cut interest rates, and gold rose again. However, judging from the recent market, the market stimulated by the news is still unsustainable. Since gold has rebounded now, gold will continue to sell at a high level in the early trading.
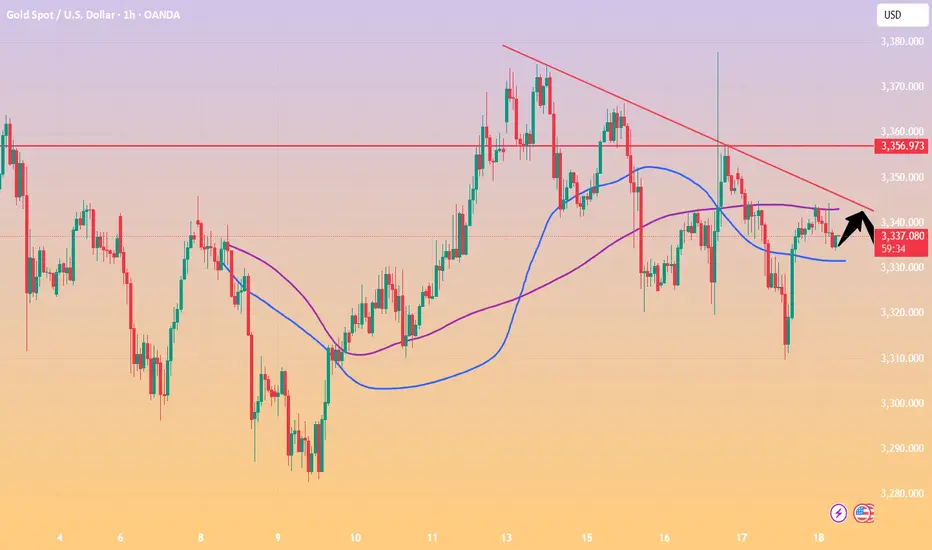
Excluding yesterday's market affected by Trump, the gold price operation pattern this week is close to perfect, and it has been steadily operating under the suppression of the downward trend line. Therefore, the market has given a clear direction. It is OK to sell when the Asian market rebounds to the pressure level. Gold is still in a fluctuating downward trend in 1 hour!
The downward trend resistance of gold has moved down to around 3350. Before gold effectively breaks through 3350, gold is under pressure at 3350 and continues to sell at high prices. Today, Friday, the probability of gold having a big market is relatively high, and if there is a big market on Friday, it is basically weak throughout the day. If it is strong, it is strong throughout the day. As long as gold continues to be weak in the European market, it is likely that gold will continue to fall today.
Operation ideas:
Buy short-term gold at 3317-3320, stop loss at 3308, target at 3340-3360;
Sell short-term gold at 3352-3355, stop loss at 3364, target at 3330-3310;
Key points:
First support level: 3323, second support level: 3310, third support level: 3290
First resistance level: 3348, second resistance level: 3360, third resistance level: 3377
In the early Asian session on Friday (July 18), spot gold fluctuated in a narrow range and is currently trading around $3,336 per ounce. London gold prices staged a thrilling "deep V" market yesterday, hitting a daily low of $3,309 during the session and recovering to 3,339 at the end of the session. Strong US retail sales and employment data drove the dollar to rebound and US Treasury yields to rise, putting pressure on interest-free assets such as gold. Despite this, geopolitical tensions and rising tariff risks are still providing bottom support for the gold market. The international gold market is currently in a multi-game of Fed policies, US economic data, US dollar trends and tariff policies. The Fed's position of postponing interest rate cuts, strong retail and employment data, and the rise in the US dollar and US Treasury yields have suppressed gold prices in the short term. This trading day needs to pay attention to the preliminary value of the University of Michigan Consumer Confidence Index in July and US real estate market data, pay attention to the G20 Finance Ministers and Central Bank Governors Meeting hosted by South Africa, and pay attention to news related to the international trade situation.
Technical Review:
Gold closed with a small positive line with a long upper shadow yesterday. Although it ended the continuous negative trend, it still faced sideways resistance below 3374, and the overall market still needs to be treated as a shock consolidation. From a large cycle perspective, gold has entered a convergent triangle consolidation phase of nearly three months. Among them, the lower track support line gradually moved up to above 3310. The support strength of this position continues to increase as the consolidation time lengthens. If the price touches or approaches this point, you can decisively try to buy the bottom layout.For two consecutive trading days, gold has been consolidating in a larger range of 3377/3310, and finally closed at the starting point of the daily Bollinger band middle track at the end of the trading day. Gold returned to the middle axis of the range at 3340. The daily chart Bollinger band middle track, the RSI indicator middle axis flattened, the four-hour chart hourly chart Bollinger band middle track, and the RSI indicator neutral middle axis. On Friday, the layout of the day will still be based on a wide range of fluctuations. Look at the 3320/3360 range first. Alternating buying and selling cycles, large range of wide fluctuations!
Today's analysis:
In the past two days, gold has always risen in the US market due to news. Last night, Trump called on the Federal Reserve to cut interest rates, and gold rose again. However, judging from the recent market, the market stimulated by the news is still unsustainable. Since gold has rebounded now, gold will continue to sell at a high level in the early trading.
Excluding yesterday's market affected by Trump, the gold price operation pattern this week is close to perfect, and it has been steadily operating under the suppression of the downward trend line. Therefore, the market has given a clear direction. It is OK to sell when the Asian market rebounds to the pressure level. Gold is still in a fluctuating downward trend in 1 hour!
The downward trend resistance of gold has moved down to around 3350. Before gold effectively breaks through 3350, gold is under pressure at 3350 and continues to sell at high prices. Today, Friday, the probability of gold having a big market is relatively high, and if there is a big market on Friday, it is basically weak throughout the day. If it is strong, it is strong throughout the day. As long as gold continues to be weak in the European market, it is likely that gold will continue to fall today.
Operation ideas:
Buy short-term gold at 3317-3320, stop loss at 3308, target at 3340-3360;
Sell short-term gold at 3352-3355, stop loss at 3364, target at 3330-3310;
Key points:
First support level: 3323, second support level: 3310, third support level: 3290
First resistance level: 3348, second resistance level: 3360, third resistance level: 3377
Good trading signals can help you make profits in the market. I will share trading signal analysis of various products every day, hoping to help you!
t.me/+WHE58rEaywExNWVh
t.me/+WHE58rEaywExNWVh
Disclaimer
The information and publications are not meant to be, and do not constitute, financial, investment, trading, or other types of advice or recommendations supplied or endorsed by TradingView. Read more in the Terms of Use.