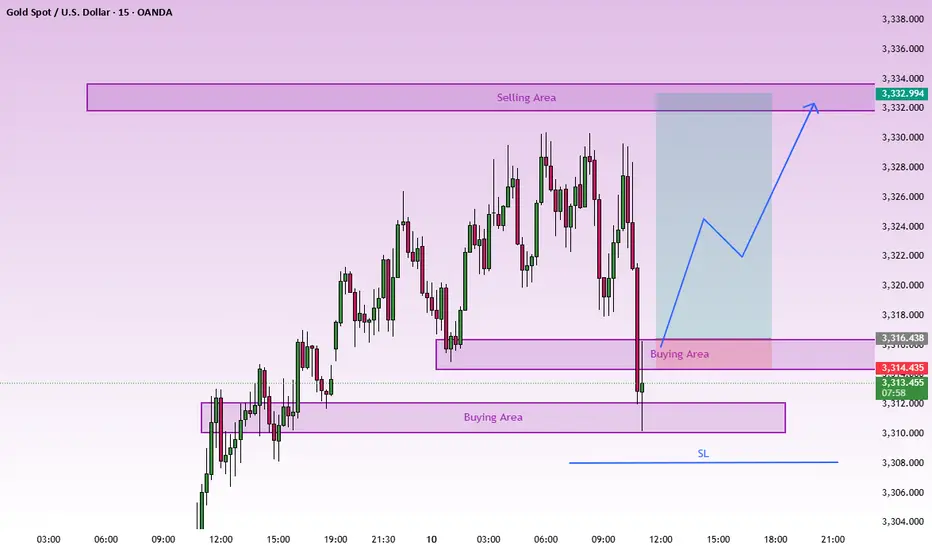
Instrument: XAU/USD (Gold Spot)
Timeframe: 15-minute (top left corner)
Price: ~3,320.617 at the time of the screenshot
Chart Type: Candlestick chart
Annotations on the Chart:
Buying Area (Demand Zone):
Marked in light purple/pink at the bottom.
Price range: approximately 3,317.041 to 3,314.038
The chart suggests a potential bullish reversal from this zone.
Selling Area (Supply Zone):
Marked in the same color at the top.
Price range: approximately 3,332.000 to 3,334.000
Potential target area for the price to reverse or consolidate.
Forecasted Price Action:
A blue zig-zag arrow indicates an expected upward move:
Starting from the Buying Area, suggesting a long/buy entry.
Projected to rise towards the Selling Area, where a reversal or profit-taking might occur.
Other Notes:
The trading chart includes various indicators and drawing tools on the left side.
The chart is part of a technical analysis approach, likely using supply and demand zones.
Bottom right timestamp: Fri 11 Jul 25 (probably a future date setting for backtesting or forward projection).
This appears to be a bullish setup, expecting price to bounce from the lower demand zone toward the upper supply zone.
Forex trader with 8+ years of experience in analysis, strategy, and consistent market success. Join now for free signals.
Disclaimer
The information and publications are not meant to be, and do not constitute, financial, investment, trading, or other types of advice or recommendations supplied or endorsed by TradingView. Read more in the Terms of Use.