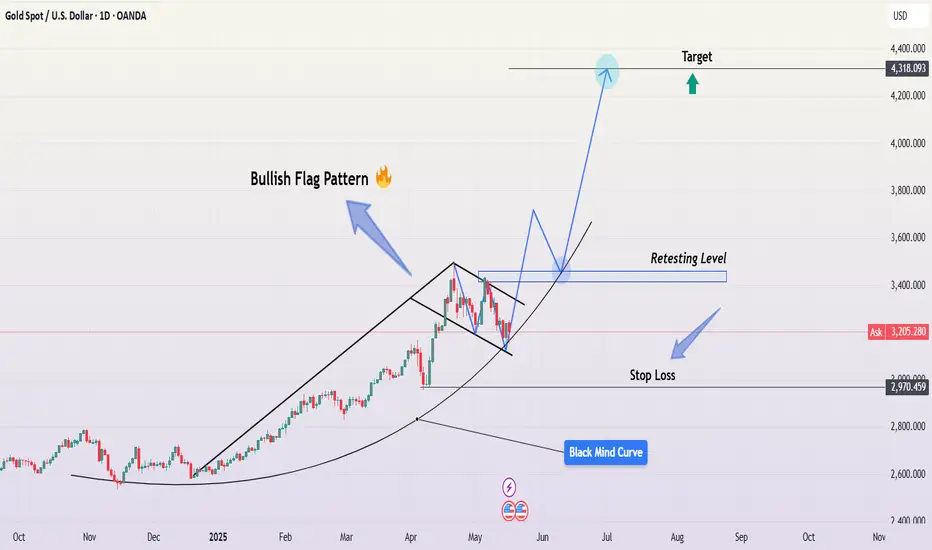
Gold (XAUUSD) is currently shaping a textbook bullish flag pattern on the daily chart, signaling a potential continuation of the strong uptrend that started late last year. This setup, when combined with the custom-drawn Black Mind Curve, provides a structured and disciplined approach for identifying entry, retest, stop loss, and profit targets. Let’s break it down in detail:
🔍 1. Flagpole: The Impulse Move
The rally from around $2,550 in December 2024 to nearly $3,330 in April 2025 formed a steep and aggressive uptrend, which now serves as the flagpole of our pattern.
This impulsive wave represents strong buying momentum and is the backbone of the entire bullish flag structure. It shows institutional interest and heavy volume participation in gold, likely driven by macroeconomic factors such as inflation hedging, USD weakness, or geopolitical uncertainty.
🔷 2. Bullish Flag: The Consolidation Zone
Following the peak, gold entered a consolidation phase, forming two parallel descending trendlines, indicating healthy profit-taking and temporary market indecision. This is not a reversal but rather a pause in the trend, often seen before the next leg higher.
This down-sloping consolidation resembles a flag pattern—a reliable bullish continuation formation where the price temporarily contracts before a breakout.
The flag pattern is still valid as long as price remains inside or breaks above the upper boundary with momentum.
📈 3. Breakout Signal and Retesting Level
As of now, price is testing the upper boundary of the flag. A bullish breakout is anticipated once price closes above the $3,300–$3,350 resistance zone.
Following the breakout, a pullback to retest this same level is expected, forming a new support zone—a classic "breakout–retest–rally" setup.
💡 Retest Zone:
$3,300 to $3,350
This is your key zone to watch for confirmation. A bounce here could offer the best risk-reward entry.
🛡️ 4. Stop Loss Placement: Protecting Your Capital
To manage risk effectively, the stop loss should be placed below the lower boundary of the flag, and ideally just under the psychological round number at $2,970.
This protects your trade from a false breakout or sudden trend reversal while keeping the risk/reward ratio favorable.
🎯 5. Target Projection: Measured Move Strategy
We use the height of the flagpole (approximately $750) and project it upward from the breakout point to estimate the target price.
📌 Target Level:
$4,318 (approx.)
This aligns with technical confluence and psychological resistance above the $4,300 level.
If momentum remains strong and the macro environment continues to support gold prices, this level is a very realistic short-to-medium-term target.
🧠 6. The Black Mind Curve: A Unique Trend Framework
The chart features a custom “Black Mind Curve”, a smooth parabolic line following the overall trend structure. This curve acts as a visual guide for trend strength, suggesting that gold is respecting a higher time frame uptrend trajectory.
It helps reinforce that the bullish structure is still intact—even during short-term pullbacks—by mapping the psychological rhythm of market participants.
This curve is especially useful for swing traders who need to maintain conviction during consolidations.
🧠 Trading Psychology (Mind Framework):
"Charts show the facts; your mind interprets the truth."
Here’s the psychological approach for this trade:
Recognize the Setup: Bullish flag is forming—observe, don’t rush.
Wait for Confirmation: Let price break out and retest—avoid FOMO.
Act on Logic: Enter with defined stop and target—keep emotions out.
Stay Disciplined: Don’t move stop loss irrationally—trust your setup.
Let the Market Work: Once the trade is active, manage it calmly.
🔁 Summary of Trade Plan:
✅ Entry: On confirmed breakout and successful retest of $3,300–$3,350
✅ Stop Loss: Below $2,970
✅ Target: $4,318
✅ Pattern Type: Bullish Flag + Trend Curve Support
✅ Risk-Reward Ratio: ~1:3+ (Ideal setup)
📝 Final Thoughts:
This is a high-probability bullish continuation pattern supported by strong technical structure and psychological market behavior. The breakout is likely to attract institutional flows, especially if it aligns with fundamental tailwinds like falling interest rates or rising inflation.
Stay patient, wait for the retest confirmation, and trade with discipline. Gold is poised for a potential new leg higher—and this setup provides a structured roadmap to ride that move confidently.
Disclaimer
The information and publications are not meant to be, and do not constitute, financial, investment, trading, or other types of advice or recommendations supplied or endorsed by TradingView. Read more in the Terms of Use.
Disclaimer
The information and publications are not meant to be, and do not constitute, financial, investment, trading, or other types of advice or recommendations supplied or endorsed by TradingView. Read more in the Terms of Use.