Gold technical chart daily line upper pressure 2050-2075 and lower support 2001
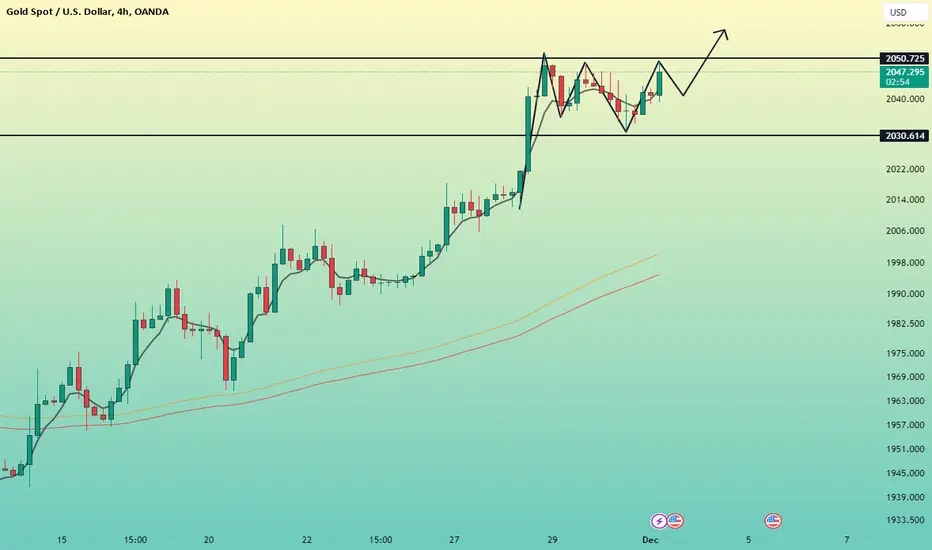
Four-hour upper pressure 2050-2075 and lower support 2030
One hour upper pressure is 2050 and lower support is 2030
From the daily line, we look at the lower support 2001-2010, 2030 in four hours, and 2040 in one hour. We continue to look at the 2100 mark. If gold retreats and continues to do long, we will first look at 2050-2075-2100 (high positions to chase long positions, low prices The position can be increased appropriately)
Long orders:
Go long near 2040 (can enter the market repeatedly)
Go long near 2030
Trade active
Trade active
Fed Powell will speak in an hour and the market will become unstable and it's time to end today's trading 💥Telegram Channel Free Updates 👉🏻
💥t.me/Actuary00group
✉️Signal and daily analysis channel
💥t.me/Actuary00group
✉️Signal and daily analysis channel
Related publications
Disclaimer
The information and publications are not meant to be, and do not constitute, financial, investment, trading, or other types of advice or recommendations supplied or endorsed by TradingView. Read more in the Terms of Use.
💥Telegram Channel Free Updates 👉🏻
💥t.me/Actuary00group
✉️Signal and daily analysis channel
💥t.me/Actuary00group
✉️Signal and daily analysis channel
Related publications
Disclaimer
The information and publications are not meant to be, and do not constitute, financial, investment, trading, or other types of advice or recommendations supplied or endorsed by TradingView. Read more in the Terms of Use.