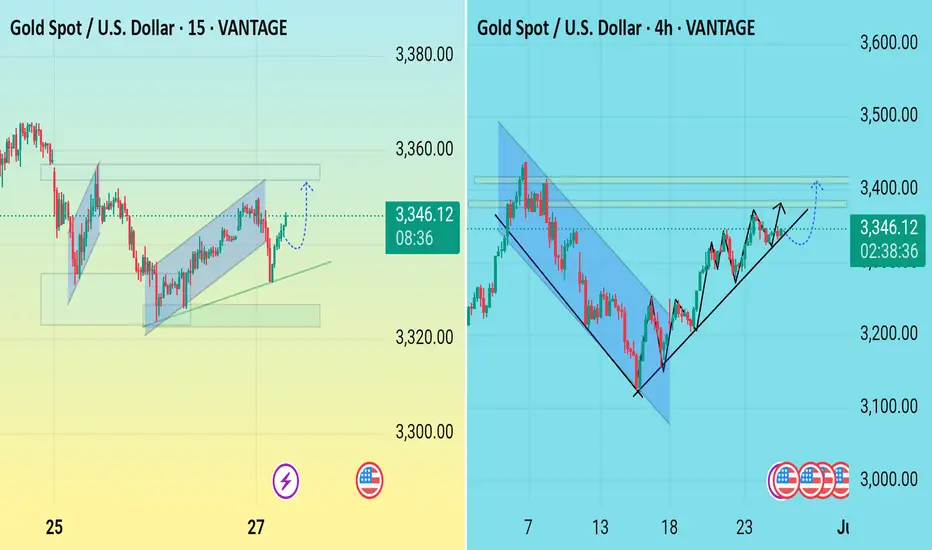
15-Minute Chart (Intraday View)
Trend Structure: Price has been trading within a small ascending channel after a prior consolidation.
Breakout Anticipation: The recent rejection at the top of the channel followed by a pullback to near the lower trendline suggests a potential bullish continuation. The dashed blue arrow implies a forecast for a bounce off the trendline and a breakout to the upside.
Support Zone: There's a visible horizontal demand zone around the 3330–3340 area, acting as a short-term support.
Bias: Bullish if price sustains above this support and breaks the local structure high.
---
4-Hour Chart (Swing/Medium-Term View)
Primary Pattern: A falling wedge breakout occurred earlier (bullish reversal pattern), leading to a strong bullish impulse.
Ascending Trendline: Price is consistently respecting an upward sloping trendline, indicating bullish market structure with higher lows.
Resistance Area: Horizontal resistance between 3340–3400, as shown by the multiple yellow shaded zones.
Projected Move: Blue dotted line indicates an expected consolidation or pullback before a continuation move toward 3400+. The solid black arrow suggests a more immediate bullish scenario.
---
Overall Analysis & Outlook
Trend: Bullish on both intraday and swing timeframes.
Key Levels:
Support: 3320–3340
Resistance: 3380–3400
Trading Idea:
Aggressive Entry: Long from current support zone targeting 3380–3400, with tight stop below 3320.
Conservative Entry: Wait for a confirmed breakout above 3380 with a retest for entry.
Trade active
Trade closed: target reached
t.me/htGGOLD_SOUK_Trd
🟢All Pairs Signals Provided
🟡XAUUSD AND CRYPTO
✅Just Register now and Enjoy
✅No swap & No commission
one.exnesstrack.org/a/siuhoykv4s
🟢All Pairs Signals Provided
🟡XAUUSD AND CRYPTO
✅Just Register now and Enjoy
✅No swap & No commission
one.exnesstrack.org/a/siuhoykv4s
Disclaimer
The information and publications are not meant to be, and do not constitute, financial, investment, trading, or other types of advice or recommendations supplied or endorsed by TradingView. Read more in the Terms of Use.