On June 24, 2025, XAUUSD (spot gold) continues to face significant bearish pressure after failing to hold above the key resistance zone around 3,383 – 3,400 USD/oz. This area marks a confluence of the 0.5–0.618 Fibonacci retracement levels and a high-volume distribution zone, signaling strong supply dominance in the short term.
Technical Structure and Fibonacci Analysis
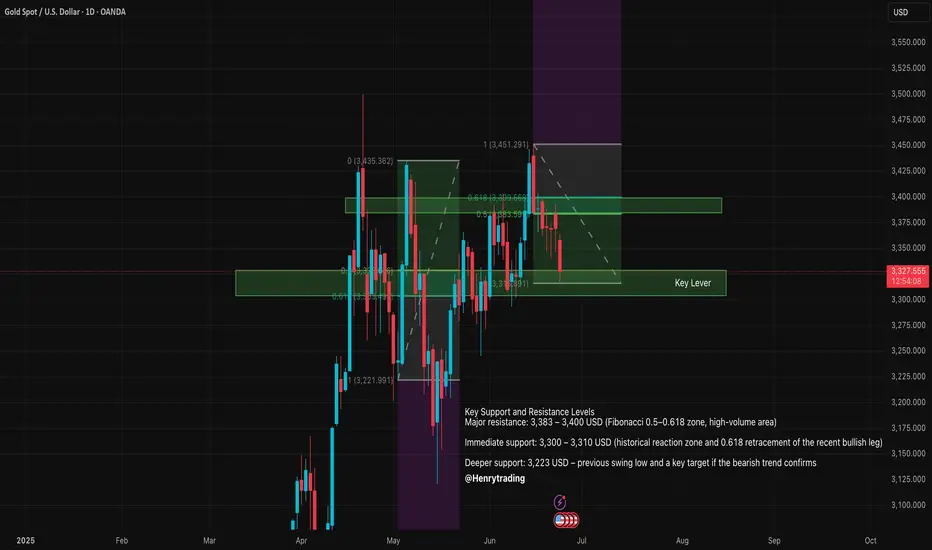
- The recent swing high was established at 3,451 USD, completing a bullish wave from the low of 3,223 USD.
- Price was unable to break through the 0.618 Fibonacci retracement at 3,399 USD, leading to a sharp pullback.
- The current structure suggests the formation of a potential head and shoulders pattern, which would confirm if the market breaks below the 3,300 USD support zone.

Key Support and Resistance Levels
- Major resistance: 3,383 – 3,400 USD (Fibonacci 0.5–0.618 zone, high-volume area)
- Immediate support: 3,300 – 3,310 USD (historical reaction zone and 0.618 retracement of the recent bullish leg)
- Deeper support: 3,223 USD – previous swing low and a key target if the bearish trend confirms
Potential Scenarios
- Bearish scenario: If the price sustains below 3,350 USD and decisively breaks 3,300 USD, it may signal the start of a medium-term downtrend, with targets near 3,200 USD or even lower.
- Bullish scenario: A bounce from the 3,300 USD support could trigger a short-term recovery, but traders should closely watch the reaction near the 3,383 – 3,400 USD resistance zone to assess supply pressure.
RSI and Momentum Indicators
- The 14-period RSI is trading below the 50 level and pointing downward, indicating that bearish momentum remains dominant.
- The RSI has also crossed below its moving average, reinforcing the negative outlook.
Ps: XAUUSD is currently in a critical phase as it tests the 3,300 USD support level. A break below this level could confirm further downside and strengthen the bearish trend. Traders are advised to remain cautious, wait for clear price action confirmation, and apply strict risk management as volatility increases.
Technical Structure and Fibonacci Analysis
- The recent swing high was established at 3,451 USD, completing a bullish wave from the low of 3,223 USD.
- Price was unable to break through the 0.618 Fibonacci retracement at 3,399 USD, leading to a sharp pullback.
- The current structure suggests the formation of a potential head and shoulders pattern, which would confirm if the market breaks below the 3,300 USD support zone.
Key Support and Resistance Levels
- Major resistance: 3,383 – 3,400 USD (Fibonacci 0.5–0.618 zone, high-volume area)
- Immediate support: 3,300 – 3,310 USD (historical reaction zone and 0.618 retracement of the recent bullish leg)
- Deeper support: 3,223 USD – previous swing low and a key target if the bearish trend confirms
Potential Scenarios
- Bearish scenario: If the price sustains below 3,350 USD and decisively breaks 3,300 USD, it may signal the start of a medium-term downtrend, with targets near 3,200 USD or even lower.
- Bullish scenario: A bounce from the 3,300 USD support could trigger a short-term recovery, but traders should closely watch the reaction near the 3,383 – 3,400 USD resistance zone to assess supply pressure.
RSI and Momentum Indicators
- The 14-period RSI is trading below the 50 level and pointing downward, indicating that bearish momentum remains dominant.
- The RSI has also crossed below its moving average, reinforcing the negative outlook.
Ps: XAUUSD is currently in a critical phase as it tests the 3,300 USD support level. A break below this level could confirm further downside and strengthen the bearish trend. Traders are advised to remain cautious, wait for clear price action confirmation, and apply strict risk management as volatility increases.
🪙 JOIN OUR FREE TELEGRAM GROUP 🪙
t.me/dnaprofits
Join the community group to get support and share knowledge!
️🥇 Exchange and learn market knowledge
️🥇 Support free trading signals
t.me/dnaprofits
Join the community group to get support and share knowledge!
️🥇 Exchange and learn market knowledge
️🥇 Support free trading signals
Related publications
Disclaimer
The information and publications are not meant to be, and do not constitute, financial, investment, trading, or other types of advice or recommendations supplied or endorsed by TradingView. Read more in the Terms of Use.