Market news:
In the early Asian session on Friday (June 6), spot gold fluctuated slightly higher and is currently trading near the 3360 mark. London gold prices rose and fell on Thursday. Earlier in the session, silver broke through the $35 mark, hitting a 13-year high, driving the international gold price to break through the 3400 mark, hitting a nearly four-week high of around $3403/ounce, but then due to the signal of easing trade tensions released by the leaders of China and the United States!At the same time, data showed that the number of initial jobless claims in the United States increased for the second consecutive week. Now all eyes turn to Friday's non-farm payrolls report. Trump again called on Federal Reserve Chairman Jerome Powell to cut interest rates on Wednesday. And the easing of trade tensions directly affected the performance of safe-haven assets. The decline in gold prices reflects the market's optimistic expectations for the progress of Sino-US trade negotiations, weakening the attractiveness of gold as a safe-haven asset!The market is closely watching the upcoming non-farm payrolls data and the Fed's meeting resolution on June 17-18 to judge the short-term direction of gold prices. On the whole, international gold still has long-term investment value under the current global economic and geopolitical uncertainties. In the short term, it may fluctuate in a relatively high range, waiting for more guidance from economic data and policy signals.
Technical Review:
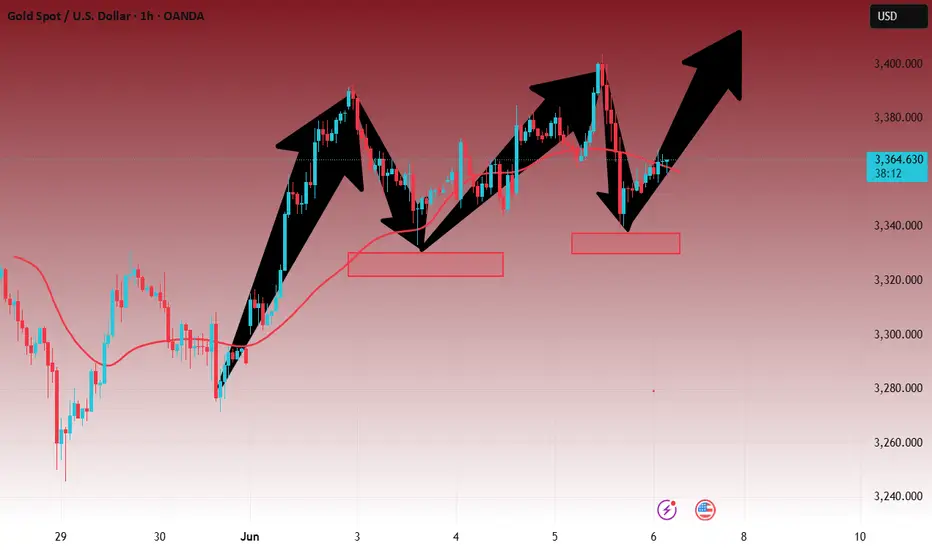
Gold closed alternately in the first four trading days of this week. Yesterday, gold rose sharply in the Asian and European sessions, and fell back in the US session. The roller coaster at the end of the session gave up all the gains during the day and fell below the 3350 mark to touch the 3339 line. The daily line pattern turned from a big positive to a big negative K and closed above 3350. Technically, the daily chart has alternated between positive and negative for four consecutive trading days. The US session fell sharply and tested the MA7-day moving average, but the price is still running above the MA10/7-day moving average. The Bollinger band of the short-term four-hour chart closed, the RSI indicator's middle axis flattened, and the hourly chart's four-hour moving average was glued. The technical side of gold intraday trading is arranged with a shock idea, and the intraday range refers to the 3328/3388 layout. Fundamentals today focus on the non-agricultural data released at 20:30 in the evening. The previous value was 177,000, and the market estimated value was only 130,000. According to the estimated value, it is bullish for gold and silver.
Today's analysis:
This year, it has been emphasized that 2025 is a strong year for gold. Gold may enter an accelerated buying structure this year. Tariff trade policies, geopolitical tensions, the Federal Reserve's interest rate decision, the decline in confidence in US bonds, and the increase in global central bank purchases have affected gold as a strong hedging tool. There will be room for growth. Therefore, as long as the overall environment remains unchanged, gold is still an absolute buying trend. Therefore, no matter how it is adjusted, it is an opportunity to buy into the warehouse. This week, gold remained in the range of 3332-3392 for the first three days. During this period, we sold at a high price and bought at a low price, which was also considered to have completed the expectations. Then, on Thursday and Friday, gold will remain in this range and look up. If the rise breaks through and stabilizes at 3400, the upper side will look at 3500. If it breaks through 3330, the lower side will look at 3280. Look for fluctuations before non-agricultural data, and then look at the impact of non-agricultural data.
Operation ideas:
Short-term gold 3340-3360 buy, stop loss 3330, target 3380-3400;
Short-term gold 3387-3390 short, stop loss 3400, target 3350-3330;
Key points:
First support level: 3342, second support level: 3328, third support level: 3303
First resistance level: 3376, second resistance level: 3388, third resistance level: 3410
In the early Asian session on Friday (June 6), spot gold fluctuated slightly higher and is currently trading near the 3360 mark. London gold prices rose and fell on Thursday. Earlier in the session, silver broke through the $35 mark, hitting a 13-year high, driving the international gold price to break through the 3400 mark, hitting a nearly four-week high of around $3403/ounce, but then due to the signal of easing trade tensions released by the leaders of China and the United States!At the same time, data showed that the number of initial jobless claims in the United States increased for the second consecutive week. Now all eyes turn to Friday's non-farm payrolls report. Trump again called on Federal Reserve Chairman Jerome Powell to cut interest rates on Wednesday. And the easing of trade tensions directly affected the performance of safe-haven assets. The decline in gold prices reflects the market's optimistic expectations for the progress of Sino-US trade negotiations, weakening the attractiveness of gold as a safe-haven asset!The market is closely watching the upcoming non-farm payrolls data and the Fed's meeting resolution on June 17-18 to judge the short-term direction of gold prices. On the whole, international gold still has long-term investment value under the current global economic and geopolitical uncertainties. In the short term, it may fluctuate in a relatively high range, waiting for more guidance from economic data and policy signals.
Technical Review:
Gold closed alternately in the first four trading days of this week. Yesterday, gold rose sharply in the Asian and European sessions, and fell back in the US session. The roller coaster at the end of the session gave up all the gains during the day and fell below the 3350 mark to touch the 3339 line. The daily line pattern turned from a big positive to a big negative K and closed above 3350. Technically, the daily chart has alternated between positive and negative for four consecutive trading days. The US session fell sharply and tested the MA7-day moving average, but the price is still running above the MA10/7-day moving average. The Bollinger band of the short-term four-hour chart closed, the RSI indicator's middle axis flattened, and the hourly chart's four-hour moving average was glued. The technical side of gold intraday trading is arranged with a shock idea, and the intraday range refers to the 3328/3388 layout. Fundamentals today focus on the non-agricultural data released at 20:30 in the evening. The previous value was 177,000, and the market estimated value was only 130,000. According to the estimated value, it is bullish for gold and silver.
Today's analysis:
This year, it has been emphasized that 2025 is a strong year for gold. Gold may enter an accelerated buying structure this year. Tariff trade policies, geopolitical tensions, the Federal Reserve's interest rate decision, the decline in confidence in US bonds, and the increase in global central bank purchases have affected gold as a strong hedging tool. There will be room for growth. Therefore, as long as the overall environment remains unchanged, gold is still an absolute buying trend. Therefore, no matter how it is adjusted, it is an opportunity to buy into the warehouse. This week, gold remained in the range of 3332-3392 for the first three days. During this period, we sold at a high price and bought at a low price, which was also considered to have completed the expectations. Then, on Thursday and Friday, gold will remain in this range and look up. If the rise breaks through and stabilizes at 3400, the upper side will look at 3500. If it breaks through 3330, the lower side will look at 3280. Look for fluctuations before non-agricultural data, and then look at the impact of non-agricultural data.
Operation ideas:
Short-term gold 3340-3360 buy, stop loss 3330, target 3380-3400;
Short-term gold 3387-3390 short, stop loss 3400, target 3350-3330;
Key points:
First support level: 3342, second support level: 3328, third support level: 3303
First resistance level: 3376, second resistance level: 3388, third resistance level: 3410
Disclaimer
The information and publications are not meant to be, and do not constitute, financial, investment, trading, or other types of advice or recommendations supplied or endorsed by TradingView. Read more in the Terms of Use.
Disclaimer
The information and publications are not meant to be, and do not constitute, financial, investment, trading, or other types of advice or recommendations supplied or endorsed by TradingView. Read more in the Terms of Use.