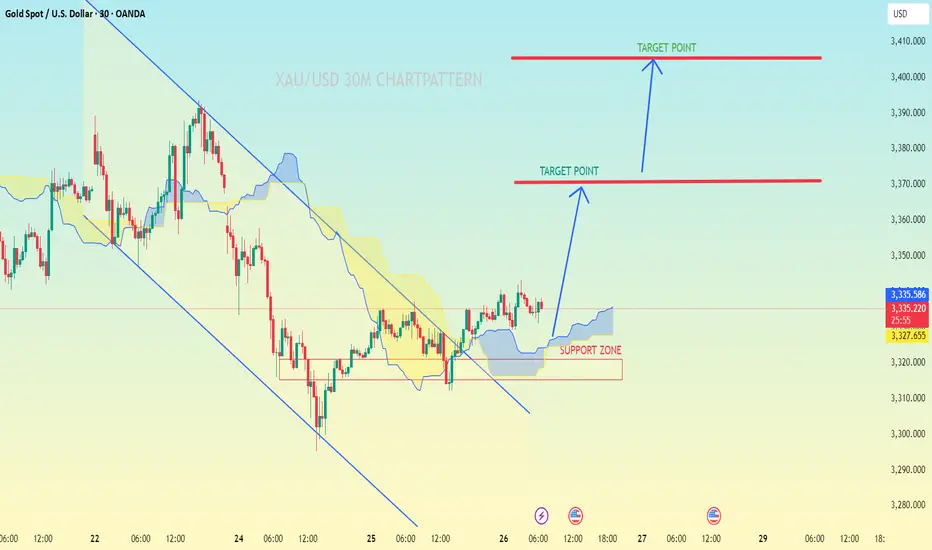
XAUUSD (Gold Spot vs USD) on the 30-minute timeframe, here’s the breakdown:
Observations:
A descending channel was broken to the upside.
Price is above the Ichimoku cloud, which often suggests bullish momentum.
There is a clearly marked support zone around 3,320 - 3,325.
Two target points are drawn with arrows indicating potential upside levels.
---
📍 Target Levels (as seen on the chart):
1. First Target: Approximately 3,370
2. Second Target: Approximately 3,405 – 3,410
These targets are based on previous resistance levels and potential price projections after the breakout.
---
✅ Strategy Suggestion (if you're trading this):
Entry Zone: Around 3,327 – 3,330 (current level)
Stop Loss: Below Support Zone (~3,315)
Take Profits:
TP1: 3,370
TP2: 3,405 – 3,410
Let me know if you'd like Fibonacci levels or RSI confirmation as well.
Trade active
target activet.me/forexofdollarsmagnet
Forex, gold and crypto signal's with detailed analysis & get consistent results..
t.me/Jhonscalpertrade11
Gold signal's with proper TP & SL for high profits opportunities..
Forex, gold and crypto signal's with detailed analysis & get consistent results..
t.me/Jhonscalpertrade11
Gold signal's with proper TP & SL for high profits opportunities..
Related publications
Disclaimer
The information and publications are not meant to be, and do not constitute, financial, investment, trading, or other types of advice or recommendations supplied or endorsed by TradingView. Read more in the Terms of Use.
t.me/forexofdollarsmagnet
Forex, gold and crypto signal's with detailed analysis & get consistent results..
t.me/Jhonscalpertrade11
Gold signal's with proper TP & SL for high profits opportunities..
Forex, gold and crypto signal's with detailed analysis & get consistent results..
t.me/Jhonscalpertrade11
Gold signal's with proper TP & SL for high profits opportunities..
Related publications
Disclaimer
The information and publications are not meant to be, and do not constitute, financial, investment, trading, or other types of advice or recommendations supplied or endorsed by TradingView. Read more in the Terms of Use.