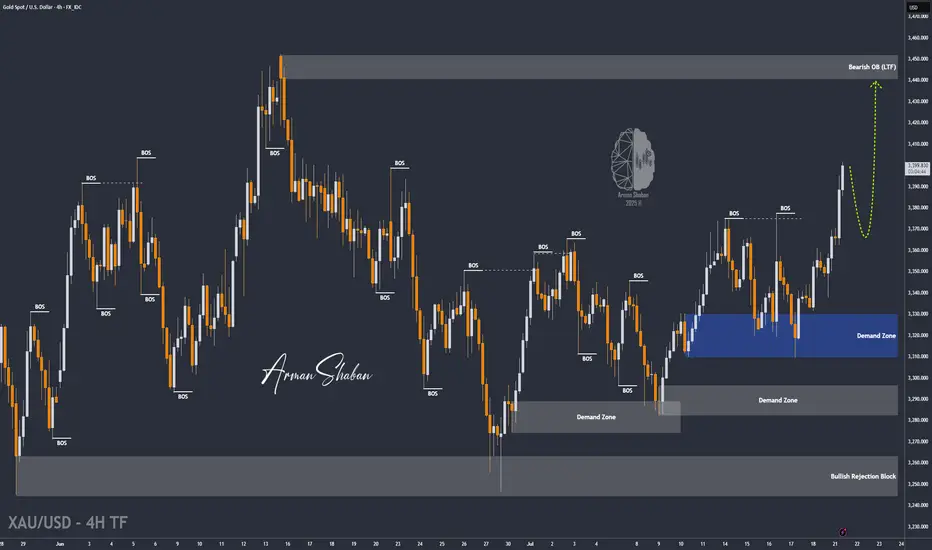
By analyzing the gold chart on the 4-hour timeframe, we can see that on Friday, the price finally closed at $3350. After the market opened today, we saw an initial correction down to $3339 (exactly as expected), followed by another strong bullish wave, pushing gold above $3400 just moments ago. If the price stabilizes below $3398 within the next 4 hours, I expect a potential rejection toward $3388 and $3377. However, if gold holds above $3400, the next target will be $3409. Key demand zones are $3365–$3375, and levels $3355, $3344, and $3336.
Please support me with your likes and comments to motivate me to share more analysis with you and share your opinion about the possible trend of this chart with me !
Best Regards , Arman Shaban
Please support me with your likes and comments to motivate me to share more analysis with you and share your opinion about the possible trend of this chart with me !
Best Regards , Arman Shaban
Trade active
By analyzing the gold chart on the 4-hour timeframe, we can see that yesterday, after climbing to $3402, the price faced initial selling pressure and dropped to $3383. However, strong buying demand pushed it back up, and gold is now powerfully breaking through resistances, reaching $3420 so far. There are still no clear signs of a price correction, and given the current trend, if gold manages to hold above $3409, we can expect a further rise toward $3440. This analysis will be updated again!⚜️ Free Telegram Channel : t.me/PriceAction_ICT
⚜️ JOIN THE VIP : t.me/PriceAction_ICT/5946
⚜️ Contact Me : t.me/ArmanShabanTrading
💥Join BitMart Exchange – Ultra Low Fees : bitmart.com/invite/c5JVJK/en-US
⚜️ JOIN THE VIP : t.me/PriceAction_ICT/5946
⚜️ Contact Me : t.me/ArmanShabanTrading
💥Join BitMart Exchange – Ultra Low Fees : bitmart.com/invite/c5JVJK/en-US
Related publications
Disclaimer
The information and publications are not meant to be, and do not constitute, financial, investment, trading, or other types of advice or recommendations supplied or endorsed by TradingView. Read more in the Terms of Use.
⚜️ Free Telegram Channel : t.me/PriceAction_ICT
⚜️ JOIN THE VIP : t.me/PriceAction_ICT/5946
⚜️ Contact Me : t.me/ArmanShabanTrading
💥Join BitMart Exchange – Ultra Low Fees : bitmart.com/invite/c5JVJK/en-US
⚜️ JOIN THE VIP : t.me/PriceAction_ICT/5946
⚜️ Contact Me : t.me/ArmanShabanTrading
💥Join BitMart Exchange – Ultra Low Fees : bitmart.com/invite/c5JVJK/en-US
Related publications
Disclaimer
The information and publications are not meant to be, and do not constitute, financial, investment, trading, or other types of advice or recommendations supplied or endorsed by TradingView. Read more in the Terms of Use.