Focus on core contradictions
New trend of long-short power game
The sharp contrast between the 5% surge last week and the 1.25% plunge this week reveals that the market has huge differences on the value center of $3,300
The negative correlation between the US dollar index and gold has increased (the recent correlation coefficient has reached -0.82), and the key watershed of the US dollar index of 102.5 needs to be monitored simultaneously
Ranking of the influence of macroeconomic data
Priority ①: Friday core PCE (the most favored inflation indicator by the Federal Reserve, expected to be 4.6%)
Priority ② :Revised GDP value on Thursday (previous value 1.6%)
Priority ③: Initial jobless claims (four consecutive weeks above 210,000 indicate a cooling of employment)
Three-dimensional positioning of technical aspects
Multi-period resonance analysis
Weekly: 5-week moving average (3282) and Bollinger middle rail (3265) form a support belt
Daily: MACD column shrinks but does not cross, suggesting adjustment rather than reversal
Key price matrix
Strong and weak boundary: US$3,300 (trading concentration area in the past 20 trading days)
Attack and defense space:
Upward: 3325 (Fibonacci 38.2%) → 3365 (weekly previous high)
Downward: 3280 (May option biggest pain point) → 3250 (200-day moving average)
Trading strategy
Scenario 1: Pre-data shock (probability 65%)
Operation: 3285-3325 interval grid trading
Buy strategy : Long at 3288-3290, stop loss at 3278, target at 3318
Short strategy: Short at 3320-3325, stop loss at 3332, target at 3292
Position management: No more than 3% per transaction, profit and loss ratio 1:3
Scenario 2: PCE data breakthrough (probability 35%)
Bull breakthrough:
Confirmation condition: 30-minute closing above 3330
Chasing strategy: Add positions after falling back to 3315, stop loss at 3300, target at 3360
Short breakthrough:
Confirmation condition: Hourly line falls below 3270
Chasing strategy: Short at rebound at 3280, stop loss at 3295, target at 32 30
Risk warning system
Black swan monitoring
Geopolitical risk indicators: observe the dynamics of the Russian-Ukrainian front + Middle East tanker premium rates
Liquidity risk: track the 3-month LIBOR-OIS spread (currently 26bp)
Trading strategy recommendations:
Algorithmic strategy: adopt a mean reversion + momentum breakthrough combination strategy
Asian session: RSI (14) 30-70 range shock trading
European and American session: Bollinger bandwidth breakthrough strategy
Hedging plan: buy gold volatility ETF (GVZ) to hedge unilateral risks
The current market is in a wait-and-see state before major data, and it is recommended to maintain a position below 50%. Medium and long-term investors can establish bottom positions in batches in the 3250-3280 area, and short-term traders focus on reverse trading opportunities after the 3315 false breakthrough. Remember: before the Fed's policy shift is confirmed, every deep adjustment of gold is a strategic position building opportunity.
Trade active
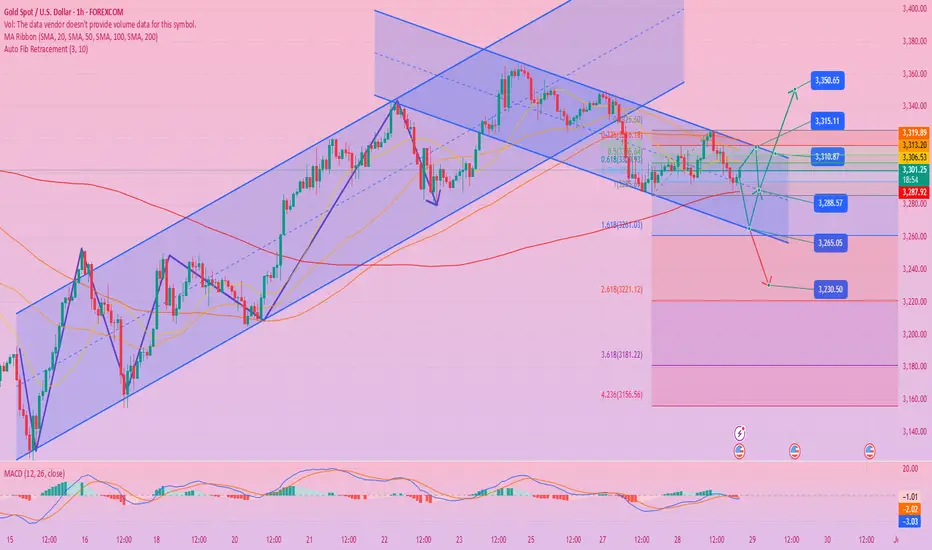
After gold experienced a decline in the Asian morning, the entire European session showed a continuous rebound trend. The price hit the 3320 line during the US session, but overall, the current market is still in a wide range of shocks. It is difficult for both long and short sides to form a sustained dominant force under this pattern. The rise and fall lacks continuity and the fluctuation range is large. Short-term operations are easily affected by repeated trends, and the difficulty of grasping is significantly increased. For the current rebound market, it is not appropriate to define it as a strong unilateral rise. The typical feature of the oscillating market is the repeated trend. In the 4-hour cycle, the opening position of 3326 can be regarded as the watershed between long and short. When operating in the US market, it is necessary to pay special attention to the pressure situation at this position: if the price runs below 3326, it is necessary to be alert to the risk of rising and falling. You can try to arrange short orders based on the 3320-3325 range and bet on the opportunity to sell high in the volatile market. It should be noted that if the price breaks through and rises to the 3340-3350 area in the short term, it is necessary to guard against the risk of a correction after an over-rise. Once a fall occurs, its strength is often equal to the rise.
On the whole, the recommended short-term operation strategy for gold today is to buy on pullbacks and go long as the main operation strategy, supplemented by shorting on rebound highs. The short-term focus on the upper side is the 3325-3335 line of resistance, and the short-term focus on the lower side is the 3290-3280 line of support.
Related publications
Disclaimer
The information and publications are not meant to be, and do not constitute, financial, investment, trading, or other types of advice or recommendations supplied or endorsed by TradingView. Read more in the Terms of Use.
Related publications
Disclaimer
The information and publications are not meant to be, and do not constitute, financial, investment, trading, or other types of advice or recommendations supplied or endorsed by TradingView. Read more in the Terms of Use.