Gold (XAUUSD) is crashing today as it broke below the 1680 Support, which is a level that got test 3 times since March 2021 and held. This is a major bearish break-out for the yellow metal and comes to confirm the analysis we posted 2.5 months ago on July 01, that went under the radar:
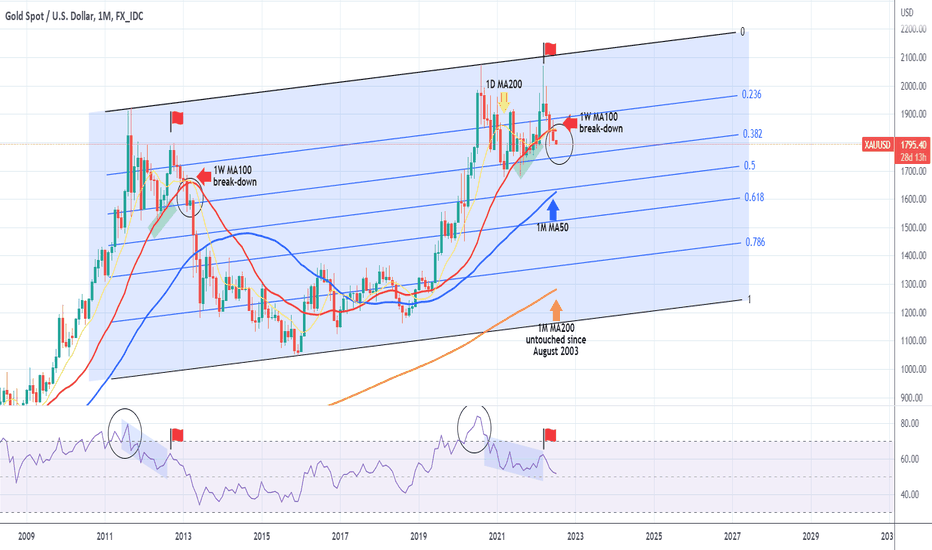
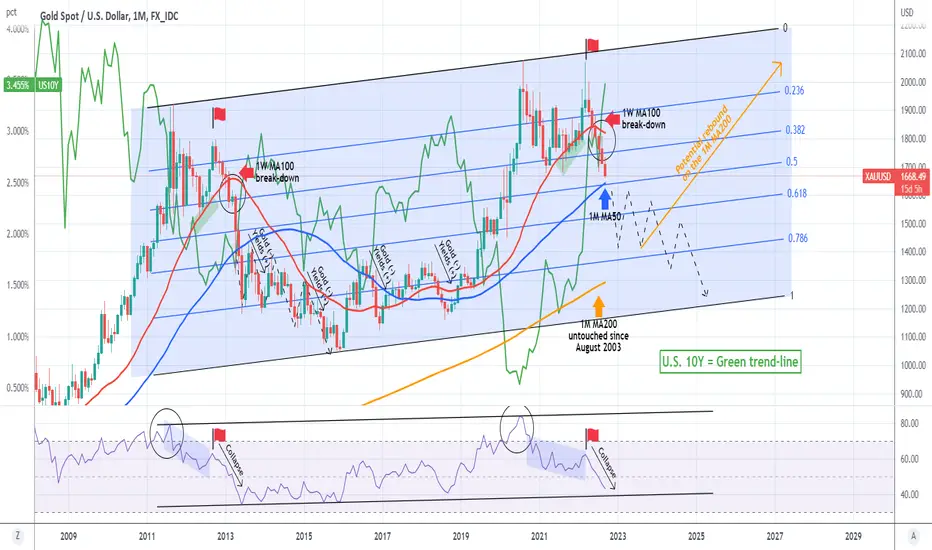
That was when we warned that Gold could be on the brink of collapse as on the 1M (monthly) time-frame, it has broken below its 1W MA100 (red trend-line) in a pattern similar to February 2013. Well the 1W MA100 was never recovered and today this is a confirmed bearish break-out, giving us the opportunity to update on that analysis.
This time, we have added the U.S. 10 year bond yield (US10Y displayed by the green trend-line), which in our opinion is the fundamental reason behind Gold's sharp selling. As this correlation shows, every time the US10Y was rising aggressively, Gold followed a negative correlation and was dropping aggressively. We have depicted those mini moves (on the 1M scale, otherwise they represent multi month moves).
The current move though is a major one, even for the 1M scale as it is getting extremely close to the 1M MA50 (blue trend-line), which has basically been the pivot within this 11 year Channel. In April 2013, the break below it saw the price extending the selling sequence below the 1M MA50 for the next 3 years that only broke above it again in June 2016. This is a potential scenario if Gold closes below the 1M MA50 and gets rejected on it upon re-test.
This time however we have the 1M MA200 (orange trend-line) coming in strongly (currently at 1292 but rising rapidly), which has been untouched since August 2003 and can make contact with the price around the 0.786 Fibonacci retracement level, assuming the trend continues. This is also in-line with the 1M RSI, which as you see is within a Channel Up since the 2011 High. As a result, we may see this time a rebound just before we hit the 1M MA200.
Back to the US10Y, like we said, the more it keeps rise, the lower it will push Gold. The reason is that the bonds are also a steady and safe asset, thus a direct competitor of Gold, which at the same time offers yields. It is reasonable to see risk-averse investors flee Gold and move capital to bonds as long as the yields rise.
So what can be next now? We saw in December 2013, that even though the US10Y reversed downwards, Gold didn't stage a rebound but instead entered this 3 year structured sell sequence below the 1M MA50. It appears that the US10Y is preparing for that move in the coming months.
--------------------------------------------------------------------------------------------------------
** Please support this idea with your likes and comments, it is the best way to keep it relevant and support me. **
--------------------------------------------------------------------------------------------------------
👑Best Signals (Forex/Crypto+70% accuracy) & Account Management (+20% profit/month on 10k accounts)
💰Free Channel t.me/tradingshotglobal
🤵Contact info@tradingshot.com t.me/tradingshot
🔥New service: next X100 crypto GEMS!
💰Free Channel t.me/tradingshotglobal
🤵Contact info@tradingshot.com t.me/tradingshot
🔥New service: next X100 crypto GEMS!
Disclaimer
The information and publications are not meant to be, and do not constitute, financial, investment, trading, or other types of advice or recommendations supplied or endorsed by TradingView. Read more in the Terms of Use.