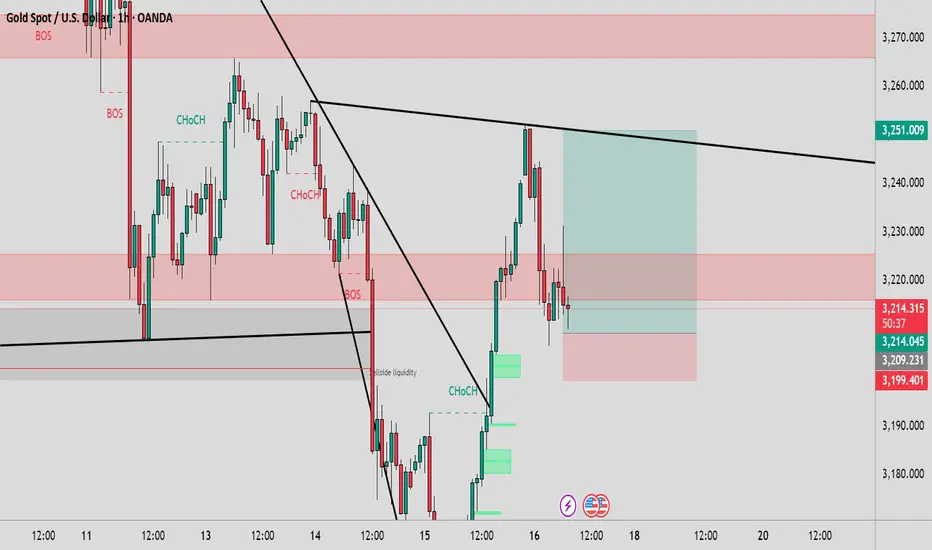
This 1-hour chart for XAU/USD (Gold Spot vs. U.S. Dollar) from TradingView displays a detailed technical analysis highlighting key market structure events such as Break of Structure (BOS), Change of Character (CHoCH), and liquidity zones. A descending trendline indicates bearish pressure, while recent CHoCH suggests a possible bullish reversal. Key supply and demand zones are marked in red, with liquidity grabs and imbalances visualized using shaded areas. Price currently hovers around the 3,211 level, approaching a resistance zone after reclaiming bullish momentum. Traders may look for reactions near the supply zone or a break above trendline resistance for confirmation.
Daily XAU/USD FREE setups | Let's grow together!
| XAU/USD Trader | Telegram: https://t.me/Aleegoldsignals
| XAU/USD Trader | Telegram: https://t.me/Aleegoldsignals
Disclaimer
The information and publications are not meant to be, and do not constitute, financial, investment, trading, or other types of advice or recommendations supplied or endorsed by TradingView. Read more in the Terms of Use.