Let's go through a top-down analysis for XAUUSD using the charts you've provided, starting from the 4-hour timeframe down to the 15-minute timeframe. I'll highlight key levels and POIs (order blocks, breaker blocks, and FVG) for possible trade setups.
1. 4-Hour Timeframe (Overall Market Structure)
* Market Structure: From the 4-hour chart, the market is in a bullish structure as it is making higher highs and higher lows.
* Key POI (Order Block / Breaker Block): There is a recent order block formed around 3,360.000, where the market pushed strongly upwards after a consolidation phase. This could be an area of interest if price revisits this level.
* Liquidity Sweep / Inducement: A potential inducement occurred when price broke the 3,375.000 level earlier, sweeping liquidity before pushing higher. This move suggests price could look to continue its upward momentum after a retrace.
* FVG: There's a gap between 3,375.000 and 3,380.000, which might get filled on a retrace. If the market revisits this level, we could expect a continuation.
2. 1-Hour Timeframe (Refining POIs)
* Market Structure: The price action continues to reflect a bullish trend, with higher highs and higher lows. The structure on this timeframe aligns with the 4-hour view.
* Key POI (Order Block / Breaker Block): There's another order block formed near 3,385.000 – 3,390.000. This is where the market saw a sharp upward movement, indicating a potential support zone for a retracement.
* Liquidity Sweep / Inducement: On this timeframe, we observe a small sweep of liquidity around 3,375.000, where price broke a minor support before rallying. This suggests further potential upside if the market returns to this level.
* FVG: There’s a noticeable gap around 3,400.000 – 3,405.000. If price comes back down into this zone, it could fill the gap before continuing the upward trend.
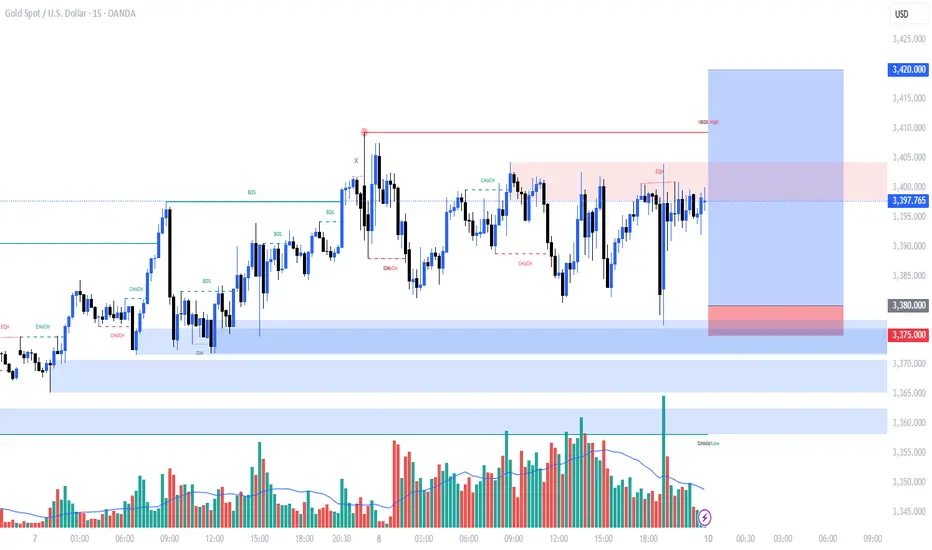
3. 15-Minute Timeframe (Entry Setup)
* Market Structure: The price continues to be bullish with a series of higher highs and higher lows in recent price action. Price is currently consolidating near the recent highs.
* Key POI (Order Block / Breaker Block): There is an order block near 3,395.000 where a sharp move upwards occurred. This could act as a potential entry point if price revisits it.
* Liquidity Sweep / Inducement: There's a liquidity sweep around 3,380.000, where price broke below before pushing upwards. If price returns to this area, we could expect a potential bounce to the upside.
* FVG: A small FVG is visible near 3,395.000. If price fills this gap and finds support, a long position could be considered.
---
TRADE SETUP
Bias: Bullish (uptrend).
* Buy Setup:
* Entry: Look for a price retracement to the order block near 3,395.000 – 3,380.000 (15-minute timeframe).
* Stop Loss: Place a stop below the recent swing low (around 3,375.000) to minimize risk.
* Target: The next target is around 3,400.000 – 3,410.000, with a secondary target at the recent high near 3,420.000 on the 4-hour timeframe.
This setup aligns with the overall bullish structure and key points of interest. If price comes back into these zones, watch for confirmation signals like rejection or reversal candlestick patterns to enter.
1. 4-Hour Timeframe (Overall Market Structure)
* Market Structure: From the 4-hour chart, the market is in a bullish structure as it is making higher highs and higher lows.
* Key POI (Order Block / Breaker Block): There is a recent order block formed around 3,360.000, where the market pushed strongly upwards after a consolidation phase. This could be an area of interest if price revisits this level.
* Liquidity Sweep / Inducement: A potential inducement occurred when price broke the 3,375.000 level earlier, sweeping liquidity before pushing higher. This move suggests price could look to continue its upward momentum after a retrace.
* FVG: There's a gap between 3,375.000 and 3,380.000, which might get filled on a retrace. If the market revisits this level, we could expect a continuation.
2. 1-Hour Timeframe (Refining POIs)
* Market Structure: The price action continues to reflect a bullish trend, with higher highs and higher lows. The structure on this timeframe aligns with the 4-hour view.
* Key POI (Order Block / Breaker Block): There's another order block formed near 3,385.000 – 3,390.000. This is where the market saw a sharp upward movement, indicating a potential support zone for a retracement.
* Liquidity Sweep / Inducement: On this timeframe, we observe a small sweep of liquidity around 3,375.000, where price broke a minor support before rallying. This suggests further potential upside if the market returns to this level.
* FVG: There’s a noticeable gap around 3,400.000 – 3,405.000. If price comes back down into this zone, it could fill the gap before continuing the upward trend.
3. 15-Minute Timeframe (Entry Setup)
* Market Structure: The price continues to be bullish with a series of higher highs and higher lows in recent price action. Price is currently consolidating near the recent highs.
* Key POI (Order Block / Breaker Block): There is an order block near 3,395.000 where a sharp move upwards occurred. This could act as a potential entry point if price revisits it.
* Liquidity Sweep / Inducement: There's a liquidity sweep around 3,380.000, where price broke below before pushing upwards. If price returns to this area, we could expect a potential bounce to the upside.
* FVG: A small FVG is visible near 3,395.000. If price fills this gap and finds support, a long position could be considered.
---
TRADE SETUP
Bias: Bullish (uptrend).
* Buy Setup:
* Entry: Look for a price retracement to the order block near 3,395.000 – 3,380.000 (15-minute timeframe).
* Stop Loss: Place a stop below the recent swing low (around 3,375.000) to minimize risk.
* Target: The next target is around 3,400.000 – 3,410.000, with a secondary target at the recent high near 3,420.000 on the 4-hour timeframe.
This setup aligns with the overall bullish structure and key points of interest. If price comes back into these zones, watch for confirmation signals like rejection or reversal candlestick patterns to enter.
Disclaimer
The information and publications are not meant to be, and do not constitute, financial, investment, trading, or other types of advice or recommendations supplied or endorsed by TradingView. Read more in the Terms of Use.
Disclaimer
The information and publications are not meant to be, and do not constitute, financial, investment, trading, or other types of advice or recommendations supplied or endorsed by TradingView. Read more in the Terms of Use.