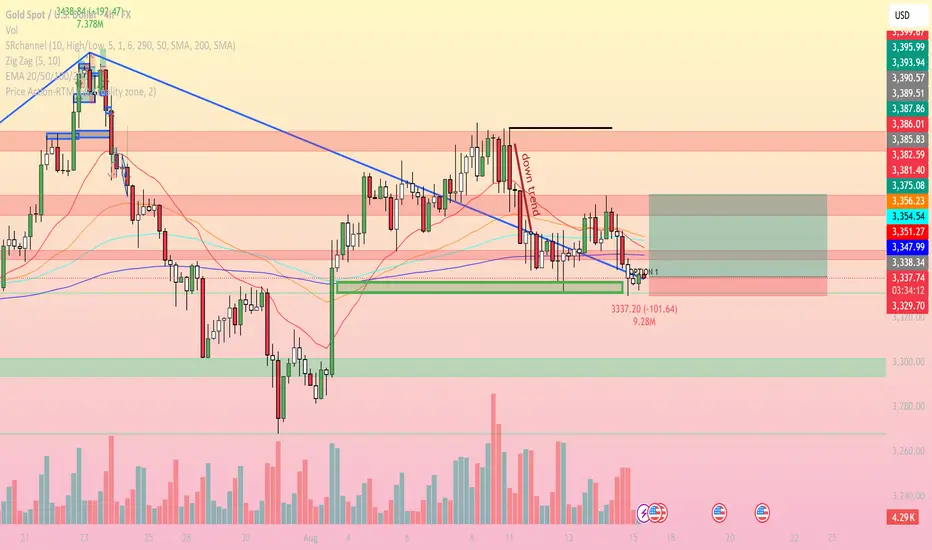
On the 4H timeframe, Gold (XAUUSD) is currently trading around 3,337 USD, moving sideways after the recent drop. Here’s the detailed outlook:
1. Trend & Price Structure
Main Trend: Short-term bearish bias remains intact, confirmed by the descending trendline and EMA 20/50/100 positioned above price.
Price is testing the 3,337–3,329 USD support zone (light green area), which is the most recent swing low.
Price action shows slowing bearish momentum with several long-tailed candles, suggesting a possible technical rebound.

2. Key Support & Resistance Levels
Immediate Resistance:
3,347–3,351 USD (EMA20 + EMA50)
3,354–3,356 USD (local high + Fibo 38.2%)
3,375 USD (Fibo 61.8% + strong H4 resistance)
Key Support:
3,337–3,329 USD (short-term support)
3,300 USD (psychological level + previous demand zone)
3. Trading Strategy Ideas
Bullish Scenario (Buy):
Buy if price breaks and closes above 3,351 USD on H4, targeting 3,356–3,375 USD, stop loss below 3,338 USD.
Bearish Scenario (Sell):
Sell if price breaks below 3,329 USD, targeting 3,300 USD, stop loss above 3,347 USD.
Apply strict risk management with R:R ≥ 1:2.
4. Overall Assessment
The market is consolidating at a strong support zone.
Without a clear bullish breakout above EMA levels, the bearish trend may resume.
Traders should wait for a confirmed breakout candle with matching volume before entering positions.
Note: This analysis is for educational purposes only and not financial advice. Follow for more trading strategies and real-time updates.
1. Trend & Price Structure
Main Trend: Short-term bearish bias remains intact, confirmed by the descending trendline and EMA 20/50/100 positioned above price.
Price is testing the 3,337–3,329 USD support zone (light green area), which is the most recent swing low.
Price action shows slowing bearish momentum with several long-tailed candles, suggesting a possible technical rebound.
2. Key Support & Resistance Levels
Immediate Resistance:
3,347–3,351 USD (EMA20 + EMA50)
3,354–3,356 USD (local high + Fibo 38.2%)
3,375 USD (Fibo 61.8% + strong H4 resistance)
Key Support:
3,337–3,329 USD (short-term support)
3,300 USD (psychological level + previous demand zone)
3. Trading Strategy Ideas
Bullish Scenario (Buy):
Buy if price breaks and closes above 3,351 USD on H4, targeting 3,356–3,375 USD, stop loss below 3,338 USD.
Bearish Scenario (Sell):
Sell if price breaks below 3,329 USD, targeting 3,300 USD, stop loss above 3,347 USD.
Apply strict risk management with R:R ≥ 1:2.
4. Overall Assessment
The market is consolidating at a strong support zone.
Without a clear bullish breakout above EMA levels, the bearish trend may resume.
Traders should wait for a confirmed breakout candle with matching volume before entering positions.
Note: This analysis is for educational purposes only and not financial advice. Follow for more trading strategies and real-time updates.
🪙 JOIN OUR FREE TELEGRAM GROUP 🪙
t.me/dnaprofits
Join the community group to get support and share knowledge!
️🥇 Exchange and learn market knowledge
️🥇 Support free trading signals
t.me/dnaprofits
Join the community group to get support and share knowledge!
️🥇 Exchange and learn market knowledge
️🥇 Support free trading signals
Related publications
Disclaimer
The information and publications are not meant to be, and do not constitute, financial, investment, trading, or other types of advice or recommendations supplied or endorsed by TradingView. Read more in the Terms of Use.