Analysis of gold trend:
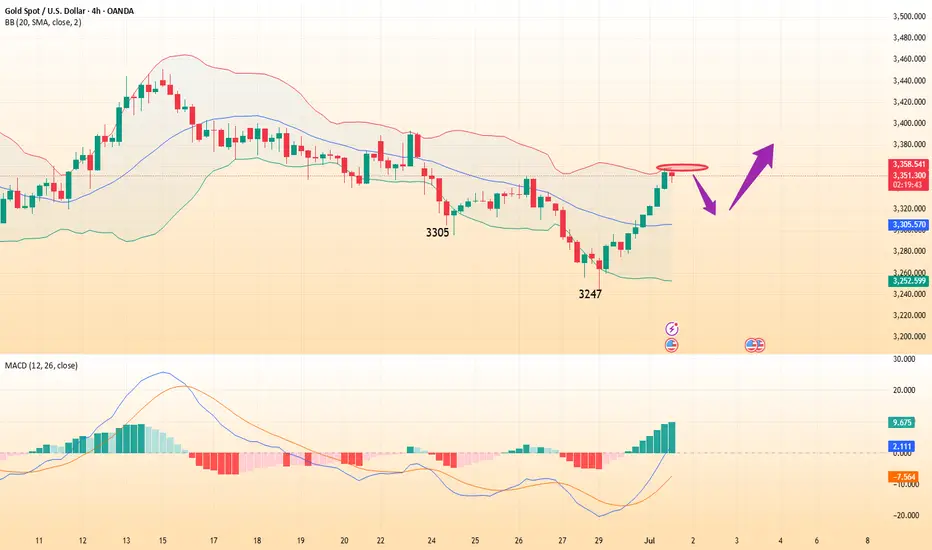
Gold fell sharply near 3247 at the opening of Monday, then stopped falling and began to fluctuate and rise slowly. It rose to a high of 3297 before the European session, then fell back after being blocked. After dropping to 3274, it stabilized again and began to rise slowly. The US session continued to rise. Another key point in the market that everyone needs to pay attention to is that the US dollar index has now hit a new low, and the current price is 96.3. This wave of US dollar decline is extremely weak, and there is basically no sign of rebound. According to this trend, the US dollar index may continue to fall, and it is possible to go to 88. In the case of such a weak US dollar index, it is natural for gold to be supported by the market. Moreover, gold has not yet walked out of the bullish trend. Gold has turned from weakness in the early stage to strength. Next, it depends on the strength of the rise. This wave of rise is expected to see 3350-3400.
From a technical point of view, gold closed positive at a low level on Monday, and the K line was above the lower Bollinger track, turning from weak to strong. Under the bullish trend, the rise can be seen to be continuous, so the high points of the middle and upper Bollinger tracks can be seen above. In the 4-hour chart, the K-line stands firmly above the middle rail of Bollinger, and the moving average system diverges upward, showing a very obvious strong performance. Therefore, the basic idea this week is to continue to do more on the decline. In the short term, first look at the upper rail of Bollinger in the 4-hour chart at 3350. There are two points to pay attention to in the decline of the small cycle within the day, one is 3300, and the other is 3285 support. Although bullish, do not chase high. After the decline, make sure to stop the decline and continue to be bullish. Operation strategy: Go long when gold falls back to around 3320, stop loss at 3210, and target 3330-3340.
Disclaimer
The information and publications are not meant to be, and do not constitute, financial, investment, trading, or other types of advice or recommendations supplied or endorsed by TradingView. Read more in the Terms of Use.
Disclaimer
The information and publications are not meant to be, and do not constitute, financial, investment, trading, or other types of advice or recommendations supplied or endorsed by TradingView. Read more in the Terms of Use.