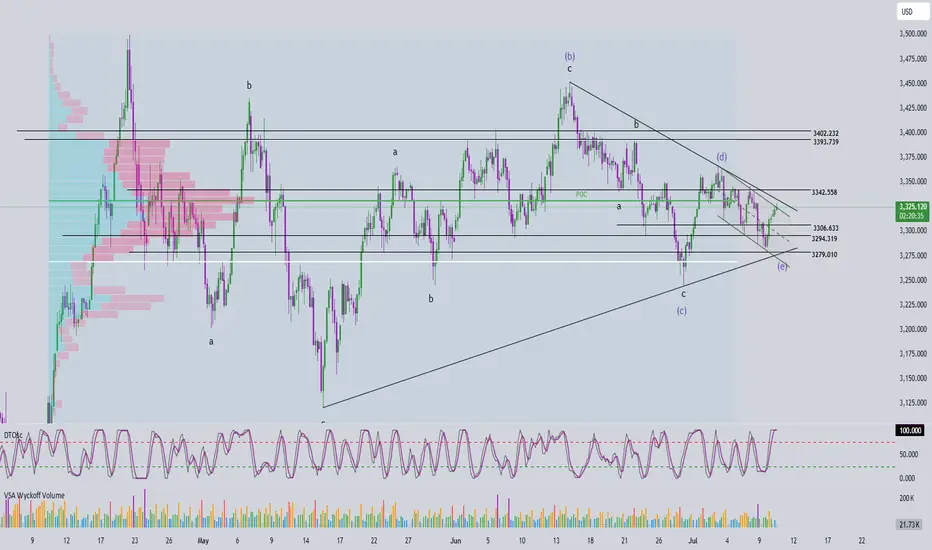
🌀 Elliott Wave Structure
On the H4 timeframe, price has returned to test the upper boundary of the converging triangle – currently acting as dynamic resistance. Based on the current wave count, wave e (purple) may have completed at the 3279 low, and price is potentially starting a breakout move.
👉 A confirmed breakout above the triangle would validate the end of the abcde correction and mark the beginning of a new upward trend.
🔋 Momentum Analysis
D1 timeframe: As forecasted yesterday, momentum is entering oversold territory and showing early signs of a reversal. This suggests that an upward trend could dominate over the next 5 days.
H4 timeframe: The two momentum lines are sticking together, indicating a weakening upward drive. A minor pullback may be needed before the next leg up. Key nearby resistance levels to watch are 3330 and 3342.
🎯 Key Price Levels & Validation Zones
The following support zones are crucial for identifying potential entries:
Support Zone 1: 3306 – 3308
Support Zone 2: 3294 – 3297
‼️ Important: A break below 3294 would invalidate the current wave structure, and a new count would be required.
📌 Trade Plan
Scenario 1 – Buy at higher support:
Buy Zone: 3308 – 3306
SL: 3303
TP1: 3342
TP2: 3366
TP3: 3390
Scenario 2 – Buy at deeper support (if stronger correction occurs):
Buy Zone: 3297 – 3294
SL: 3287
TP1: 3342
TP2: 3366
TP3: 3390
Scenario 3 – Safer option (breakout confirmation):
Wait for a breakout above the triangle, then enter on the retest (around 3325–3330)
SL: Based on structure formed during the retest
TP range: 3366 – 3390
📌 Preferred strategy: Wait for H4 to reach oversold or wait for a confirmed breakout and retest to enter safely in alignment with the new uptrend.
👉 Join the channel to receive more scalping signals!
Channel Telegram: t.me/+XkFQ95yHVOEwNDc1
Channel Telegram: t.me/+XkFQ95yHVOEwNDc1
Related publications
Disclaimer
The information and publications are not meant to be, and do not constitute, financial, investment, trading, or other types of advice or recommendations supplied or endorsed by TradingView. Read more in the Terms of Use.