Gold bulls made a strong push out of the descending channel, but now the real test begins. The market is currently in retracement mode after a sharp impulse, and the next move will be decisive.
🔹 Channel Breakout & Retest in Play:
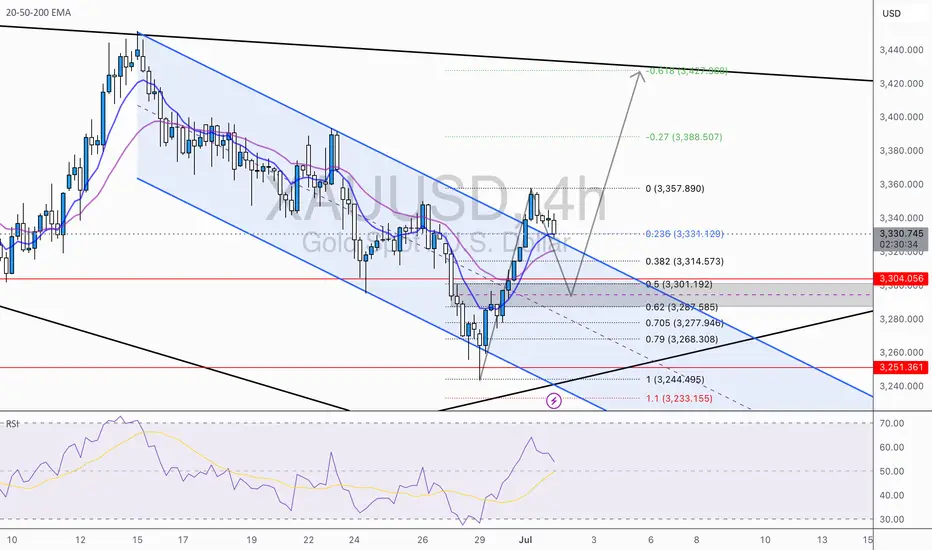
Price broke out of the descending channel with momentum and hit the $3,357 region before pulling back. We're now hovering around the 0.236 Fib at $3,331 — with the 0.382 and 0.618 Fib zones below offering potential long entry confluence.
🔹 Fibonacci Cluster Support Zone:
Between $3,314 – $3,287 lies a high-probability demand zone, where multiple Fibonacci levels converge with the broken channel top. This area also aligns with the 50 EMA, creating a pocket for bullish continuation — if held.
🔹 RSI Divergence to Watch:
RSI shows signs of slowing bullish momentum after peaking, which suggests this retracement could deepen toward the 0.5–0.618 levels before any meaningful bounce. A bullish RSI reversal in this zone would confirm re-entry.
📌 Scenario 1 – Bullish Continuation:
Price finds support between $3,314–$3,287
Momentum kicks in for a leg up toward $3,388
Final TP at $3,427 (Fib -0.618 extension)
📌 Scenario 2 – Rejection and Deeper Drop:
Failure to hold the 0.5 zone flips the bias bearish
Watch for re-entry back into the previous channel
Next downside target: $3,251 and potentially $3,233–$3,221 (Fib + extension)
💡 Elite Insight:
The pullback is not the risk — entering without a plan is. This is the zone where patience meets precision. Let the levels do the work.
🔹 Channel Breakout & Retest in Play:
Price broke out of the descending channel with momentum and hit the $3,357 region before pulling back. We're now hovering around the 0.236 Fib at $3,331 — with the 0.382 and 0.618 Fib zones below offering potential long entry confluence.
🔹 Fibonacci Cluster Support Zone:
Between $3,314 – $3,287 lies a high-probability demand zone, where multiple Fibonacci levels converge with the broken channel top. This area also aligns with the 50 EMA, creating a pocket for bullish continuation — if held.
🔹 RSI Divergence to Watch:
RSI shows signs of slowing bullish momentum after peaking, which suggests this retracement could deepen toward the 0.5–0.618 levels before any meaningful bounce. A bullish RSI reversal in this zone would confirm re-entry.
📌 Scenario 1 – Bullish Continuation:
Price finds support between $3,314–$3,287
Momentum kicks in for a leg up toward $3,388
Final TP at $3,427 (Fib -0.618 extension)
📌 Scenario 2 – Rejection and Deeper Drop:
Failure to hold the 0.5 zone flips the bias bearish
Watch for re-entry back into the previous channel
Next downside target: $3,251 and potentially $3,233–$3,221 (Fib + extension)
💡 Elite Insight:
The pullback is not the risk — entering without a plan is. This is the zone where patience meets precision. Let the levels do the work.
Trade active
TRADE ACTIVEDisclaimer
The information and publications are not meant to be, and do not constitute, financial, investment, trading, or other types of advice or recommendations supplied or endorsed by TradingView. Read more in the Terms of Use.
Disclaimer
The information and publications are not meant to be, and do not constitute, financial, investment, trading, or other types of advice or recommendations supplied or endorsed by TradingView. Read more in the Terms of Use.