#XAUUSD
The gold market closed positively on the daily chart, with strong support near 3345-3340 below. The market trend is still dominated by bulls,🐂 but the daily moving average support is too far from the high point. It is not ruled out that it may retreat to the moving average support near 3345-3340,📊 and then rise again.🚀
From the monthly chart, 🌙although the monthly chart closed positive, the market is generally converging at a high level. Upper resistance remains, and a breakout is unlikely without breaking through this resistance level (no further discussion will be given).📉
Judging from the weekly chart, the Bollinger Bands have shrunk, and the MACD indicator has formed a death cross with large volume, indicating weak fluctuations at the weekly level.😩
Judging from the daily chart, 📊the current technical indicators are tending to the zero axis, and the rapid upward correction of the smart indicator indicates that the price fluctuation tends to rebound. The current focus is on yesterday's high around 3385. It is expected to break through 3430. The lower support Bollinger band middle track and moving average tend to stick together around 3346-3340.🌈
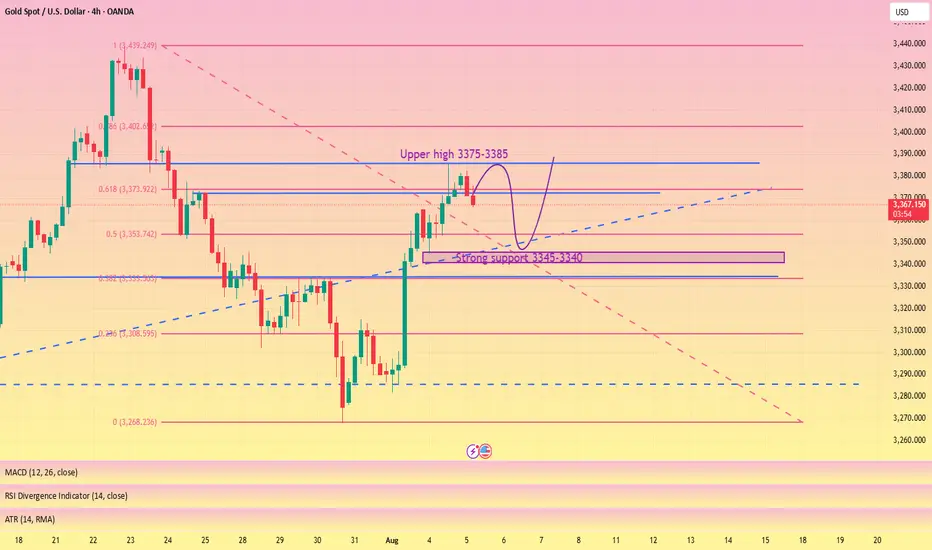
Judging from the hourly chart and 4H chart, 📊the overall rhythm tends to fluctuate and fall. The short-term pressure from above is around 3375-3385, and a break above will definitely lead to an increase.📈
On the whole, pay attention to yesterday's NY starting point near 3365-3360, and the strong support below is 3346-3340. The hourly and 4H charts tend to fluctuate and fall, so for short-term trading we need to short on rallies. 📉
Intraday trading suggestions are as follows:
1. Consider going long currently around 3365-3360📈, targeting 3374-3380🎯. If it breaks through, look for 3400.
2. Go long if it retraces below 3355-3340, targeting 3375-3385. Wait for further adjustments.🐂
3. If the price first reaches the resistance level of 3375-3385 and holds, consider going short with a small position and anticipate a pullback towards 3365-3355.🐻
The gold market closed positively on the daily chart, with strong support near 3345-3340 below. The market trend is still dominated by bulls,🐂 but the daily moving average support is too far from the high point. It is not ruled out that it may retreat to the moving average support near 3345-3340,📊 and then rise again.🚀
From the monthly chart, 🌙although the monthly chart closed positive, the market is generally converging at a high level. Upper resistance remains, and a breakout is unlikely without breaking through this resistance level (no further discussion will be given).📉
Judging from the weekly chart, the Bollinger Bands have shrunk, and the MACD indicator has formed a death cross with large volume, indicating weak fluctuations at the weekly level.😩
Judging from the daily chart, 📊the current technical indicators are tending to the zero axis, and the rapid upward correction of the smart indicator indicates that the price fluctuation tends to rebound. The current focus is on yesterday's high around 3385. It is expected to break through 3430. The lower support Bollinger band middle track and moving average tend to stick together around 3346-3340.🌈
Judging from the hourly chart and 4H chart, 📊the overall rhythm tends to fluctuate and fall. The short-term pressure from above is around 3375-3385, and a break above will definitely lead to an increase.📈
On the whole, pay attention to yesterday's NY starting point near 3365-3360, and the strong support below is 3346-3340. The hourly and 4H charts tend to fluctuate and fall, so for short-term trading we need to short on rallies. 📉
Intraday trading suggestions are as follows:
1. Consider going long currently around 3365-3360📈, targeting 3374-3380🎯. If it breaks through, look for 3400.
2. Go long if it retraces below 3355-3340, targeting 3375-3385. Wait for further adjustments.🐂
3. If the price first reaches the resistance level of 3375-3385 and holds, consider going short with a small position and anticipate a pullback towards 3365-3355.🐻
Trade active
If you're long, you can refer to and monitor the hourly closing price. If the hourly closing price shows a large negative candlestick pattern, it means the short-term correction in gold hasn't yet completed, and further declines are possible. Consider closing your long position when the price rebounds to around 3365, while simultaneously taking a small short position with a target around 3345. We'll go long again after the price stabilizes. The rest of the trading strategy remains unchanged.Trade closed: target reached
Accurately grasp the market situation and inform the long position in advance. The first notification was at 3365-3360, and the second notification was at 3355-3345. Traders who referred to and executed in advance can reap at least 500pips of profit.CFA® Charterholder | Senior Market Trading Analyst | Helping millions of users double their account funds
Free Telegram group:t.me/Insight_Precise_Analysis
Free consultation with tutors:t.me/Insight_PreciseAnalysis
Free Telegram group:t.me/Insight_Precise_Analysis
Free consultation with tutors:t.me/Insight_PreciseAnalysis
Related publications
Disclaimer
The information and publications are not meant to be, and do not constitute, financial, investment, trading, or other types of advice or recommendations supplied or endorsed by TradingView. Read more in the Terms of Use.
CFA® Charterholder | Senior Market Trading Analyst | Helping millions of users double their account funds
Free Telegram group:t.me/Insight_Precise_Analysis
Free consultation with tutors:t.me/Insight_PreciseAnalysis
Free Telegram group:t.me/Insight_Precise_Analysis
Free consultation with tutors:t.me/Insight_PreciseAnalysis
Related publications
Disclaimer
The information and publications are not meant to be, and do not constitute, financial, investment, trading, or other types of advice or recommendations supplied or endorsed by TradingView. Read more in the Terms of Use.