The daily chart for XAU/USD offers a neutral-to-bullish stance, with the pair still meeting intraday buyers around a bullish 20 Simple Moving Average (SMA). Technical indicators, in the meantime, lack directional strength, with the Momentum indicator stuck around its 100 line and the Relative Strength Index (RSI) indicator consolidating at around 58. Finally, the 100 and 200 SMAs keep grinding higher, far below the current level, limiting the bearish potential in the wider perspectiv
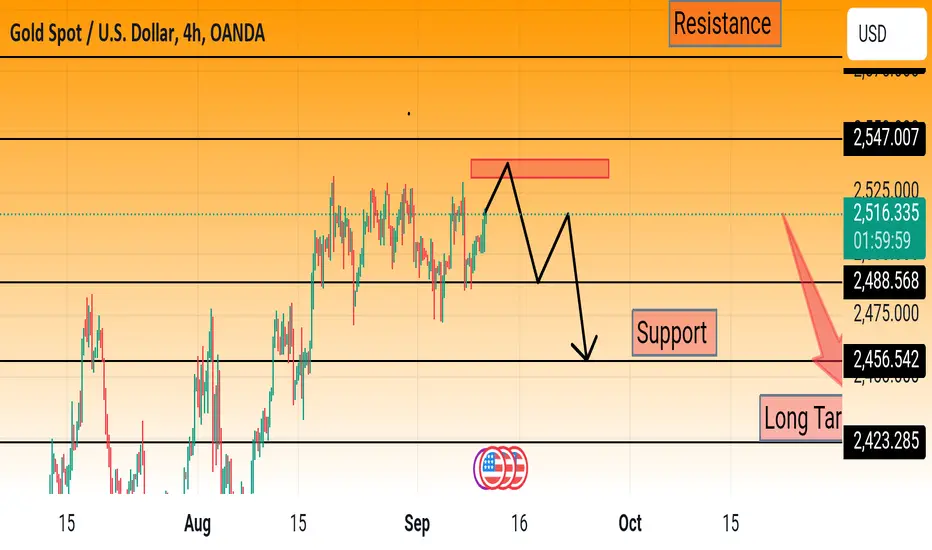
Gold now sell 2516
Support 2500
Resistance 2525
Gold now sell 2516
Support 2500
Resistance 2525
Note
Gold sell 20 pips running Note
Follow my chart Note
Gold confirm signal Note
Check my signal Gold signal
t.me/ProTrader_9
My Channel Link
t.me/ProTrader_9
Check My Performance
t.me/ProTrader_9
My Channel Link
t.me/ProTrader_9
Check My Performance
Disclaimer
The information and publications are not meant to be, and do not constitute, financial, investment, trading, or other types of advice or recommendations supplied or endorsed by TradingView. Read more in the Terms of Use.
Gold signal
t.me/ProTrader_9
My Channel Link
t.me/ProTrader_9
Check My Performance
t.me/ProTrader_9
My Channel Link
t.me/ProTrader_9
Check My Performance
Disclaimer
The information and publications are not meant to be, and do not constitute, financial, investment, trading, or other types of advice or recommendations supplied or endorsed by TradingView. Read more in the Terms of Use.