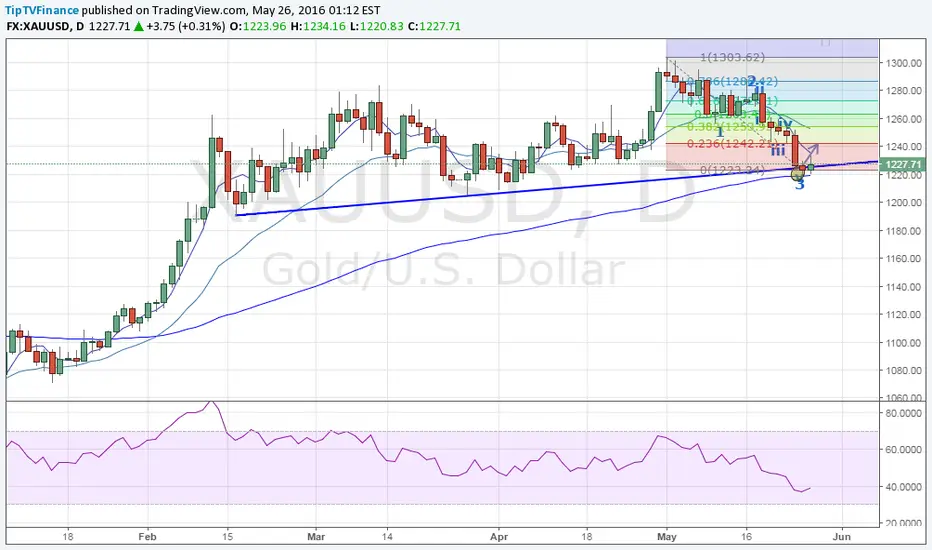
Resistance – $1230, $1236, $1249
Support– $1224.60, $1215.33, $1200
Support– $1224.60, $1215.33, $1200
- Doji formation on daily chart adds credence to a possibility of minor technical correction in gold, although prices failed near daily 5-MA in Asia.
- This if followed by a move below Asian session low of $1224.60 would open doors for a slide to daily 100-MA level of $1215.33.
- Such a move would daily RSI into oversold territory, thus leading to sideways to positive action.
Disclaimer
The information and publications are not meant to be, and do not constitute, financial, investment, trading, or other types of advice or recommendations supplied or endorsed by TradingView. Read more in the Terms of Use.
Disclaimer
The information and publications are not meant to be, and do not constitute, financial, investment, trading, or other types of advice or recommendations supplied or endorsed by TradingView. Read more in the Terms of Use.