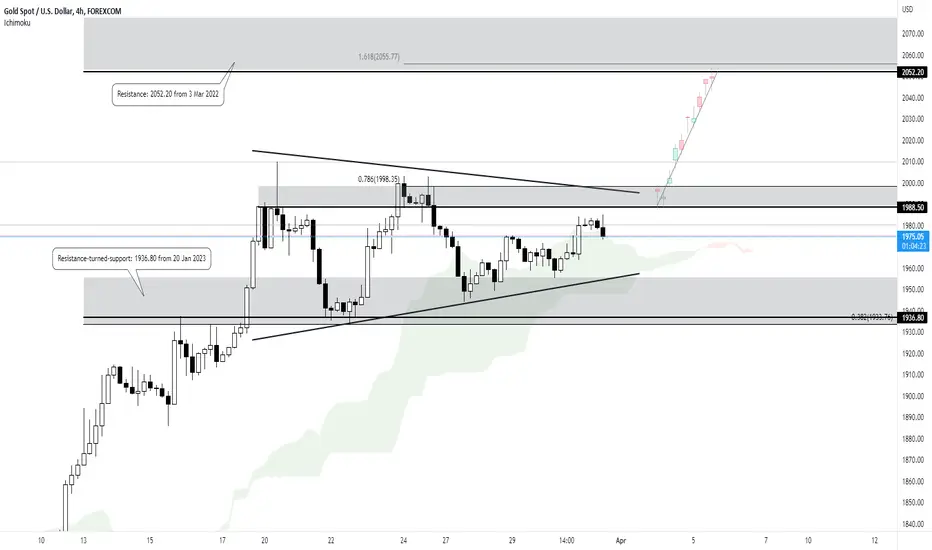
Price is consolidating between a key resistance zone at 1988.50 and a key support zone at 1936.80, forming a bullish pennant on the H4 timeframe. A break above the resistance zone at 1988.50, in line with the 78.6% Fibonacci extension level and graphical high, could provide the bullish acceleration to the next resistance zone at 2052.20, in line with the 161.8% Fibonacci extension. Price is holding above the Ichimoku cloud as well, supporting our bullish bias.
Disclaimer
The information and publications are not meant to be, and do not constitute, financial, investment, trading, or other types of advice or recommendations supplied or endorsed by TradingView. Read more in the Terms of Use.
Disclaimer
The information and publications are not meant to be, and do not constitute, financial, investment, trading, or other types of advice or recommendations supplied or endorsed by TradingView. Read more in the Terms of Use.