- In the past week, gold  XAUUSD has been under consistent selling pressure due to the following key macro factors:
- The U.S. Dollar Index (DXY) DXY surged, raising the opportunity cost of holding gold and leading to widespread sell-offs.
- 10-year U.S. Treasury yields hovered around 4.30%–4.35%, reinforcing expectations that the Fed will keep rates higher for longer.
- Core PCE data for June indicated that inflation remains elevated, reducing the likelihood of imminent rate cuts by the Federal Reserve.
- Geopolitical tensions in the Middle East have temporarily eased, diminishing gold’s safe-haven appeal in the short term.
➤ As a result, these combined factors are applying downward pressure on XAUUSD, especially after price decisively broke the 3,300 USD support zone.

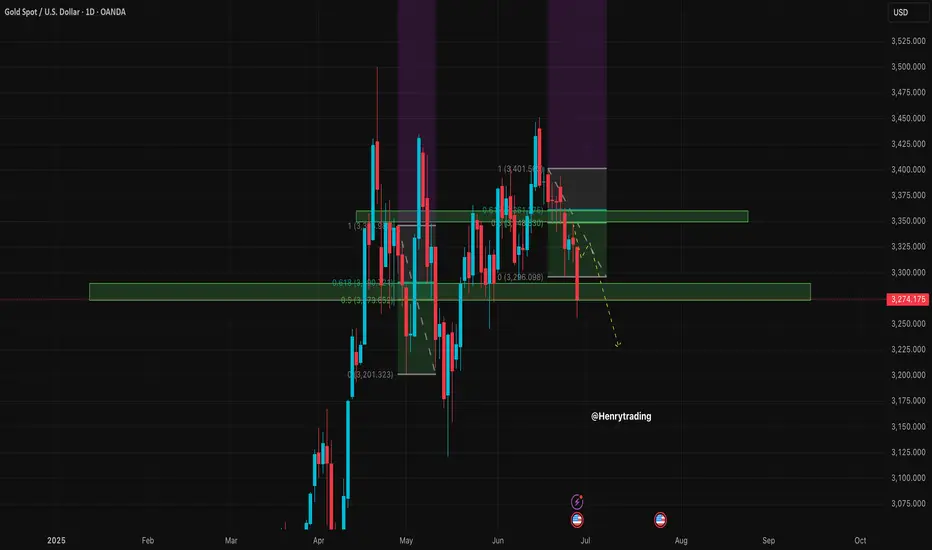
1. Technical Analysis of XAUUSD – Daily Timeframe
On the D1 chart:
- Price has broken below the key support zone 3,300 – 3,331 USD, confirming a short-term bearish structure.
- The Fibonacci retracement from the 3,399 peak to the 3,295 low has completed its pullback to the 0.5–0.618 zone (3,345 – 3,359) but was strongly rejected by sellers.
- Price is now trading below both EMA20 and EMA50, indicating strong bearish momentum.
- RSI has turned back under 50 and has not yet reached oversold territory, suggesting further downside potential exists.
2. Key Resistance and Support Zones for XAUUSD
Technical Role ( 3,345 – 3,359 )
- Major confluence resistance (Fibonacci 0.618 + supply) ( 3,295 – 3,300 )
- Immediate resistance zone (post-breakdown retest) ( 3,260 – 3,235 )
- Short-term support and potential buy interest ( 3,223 – 3,205 )
- Strong medium-term support (Fibonacci 1.0 + April lows)
3. Trading Strategy for XAUUSD This Week (30/6 – 4/7/2025)
Strategy 1 – Favor Short Positions Aligned with Bearish Momentum
Entry: Sell near 3,295 – 3,300 (anticipating resistance retest)
Stop Loss: 3,304
Take Profit 1: 3,290
Take Profit 2: 3,285
Take Profit 3: 3,275
Strategy 2 – Countertrend Buy at Key Support with Confirmation
Entry: Buy near 3,235 – 3,240 only if bullish reversal candles (pin bar or bullish engulfing) appear on H4 or D1
Stop Loss: 3,230
Take Profit 1: 3,245
Take Profit 2: 3,250
Take Profit 3: 3,260
Ps : XAUUSD is currently in a downward correction phase, with the next target zone lying between 3,235 – 3,260 USD. The inability to hold above 3,300 confirms that sellers remain in control. The most favorable approach this week is to sell on rallies, especially near former support-turned-resistance zones.
Stay vigilant, follow updated price action closely, and strictly manage risk to protect your capital.
Follow for more high-probability strategies throughout the week – and save this idea if you find it valuable to your trading journey.
Analysis by Henrybillion
- The U.S. Dollar Index (DXY)
- 10-year U.S. Treasury yields hovered around 4.30%–4.35%, reinforcing expectations that the Fed will keep rates higher for longer.
- Core PCE data for June indicated that inflation remains elevated, reducing the likelihood of imminent rate cuts by the Federal Reserve.
- Geopolitical tensions in the Middle East have temporarily eased, diminishing gold’s safe-haven appeal in the short term.
➤ As a result, these combined factors are applying downward pressure on XAUUSD, especially after price decisively broke the 3,300 USD support zone.
1. Technical Analysis of XAUUSD – Daily Timeframe
On the D1 chart:
- Price has broken below the key support zone 3,300 – 3,331 USD, confirming a short-term bearish structure.
- The Fibonacci retracement from the 3,399 peak to the 3,295 low has completed its pullback to the 0.5–0.618 zone (3,345 – 3,359) but was strongly rejected by sellers.
- Price is now trading below both EMA20 and EMA50, indicating strong bearish momentum.
- RSI has turned back under 50 and has not yet reached oversold territory, suggesting further downside potential exists.
2. Key Resistance and Support Zones for XAUUSD
Technical Role ( 3,345 – 3,359 )
- Major confluence resistance (Fibonacci 0.618 + supply) ( 3,295 – 3,300 )
- Immediate resistance zone (post-breakdown retest) ( 3,260 – 3,235 )
- Short-term support and potential buy interest ( 3,223 – 3,205 )
- Strong medium-term support (Fibonacci 1.0 + April lows)
3. Trading Strategy for XAUUSD This Week (30/6 – 4/7/2025)
Strategy 1 – Favor Short Positions Aligned with Bearish Momentum
Entry: Sell near 3,295 – 3,300 (anticipating resistance retest)
Stop Loss: 3,304
Take Profit 1: 3,290
Take Profit 2: 3,285
Take Profit 3: 3,275
Strategy 2 – Countertrend Buy at Key Support with Confirmation
Entry: Buy near 3,235 – 3,240 only if bullish reversal candles (pin bar or bullish engulfing) appear on H4 or D1
Stop Loss: 3,230
Take Profit 1: 3,245
Take Profit 2: 3,250
Take Profit 3: 3,260
Ps : XAUUSD is currently in a downward correction phase, with the next target zone lying between 3,235 – 3,260 USD. The inability to hold above 3,300 confirms that sellers remain in control. The most favorable approach this week is to sell on rallies, especially near former support-turned-resistance zones.
Stay vigilant, follow updated price action closely, and strictly manage risk to protect your capital.
Follow for more high-probability strategies throughout the week – and save this idea if you find it valuable to your trading journey.
Analysis by Henrybillion
🪙 JOIN OUR FREE TELEGRAM GROUP 🪙
t.me/dnaprofits
Join the community group to get support and share knowledge!
️🥇 Exchange and learn market knowledge
️🥇 Support free trading signals
t.me/dnaprofits
Join the community group to get support and share knowledge!
️🥇 Exchange and learn market knowledge
️🥇 Support free trading signals
Related publications
Disclaimer
The information and publications are not meant to be, and do not constitute, financial, investment, trading, or other types of advice or recommendations supplied or endorsed by TradingView. Read more in the Terms of Use.