OVERVIEW:
We are seeing signs of a potential trend reversal or major correction on Gold, with
clear structure shifts and bullish momentum building up after a deep corrective move
inside a larger descending channel. This plan is built around an entry from a key
demand zone formed after a break of structure (BOS) and mitigation of Fair Value
Gaps (FVGs) across multiple timeframes.
1. Market Story (Structure Summary)
Gold has been moving inside a downward sloping channel, defined by lower highs and
lower lows:
Trend Element Price Level
Reason
1st High (ATH)
2nd High
Lower Highs
Lower Lows
3500.20
3431.25
Start of macro descending
trendline
2nd touch, validating resistance
3412.02 → 3345.70 → 3240.13 Confirmed downtrend structure
3269.31 → 3201.43 → 3119.24 Bearish structure continuation
From this point, price found demand at 3119.24 and aggressively broke:
• Internal descending trendline (showing loss of bearish control)
• Previous structural resistance at 3191.00 (now support)
• Multiple Structure Shifts (SS) and a BOS, signaling a bullish transition
Summary: The downtrend structure is weakening. Price is breaking internal
resistances and making higher highs/lows.
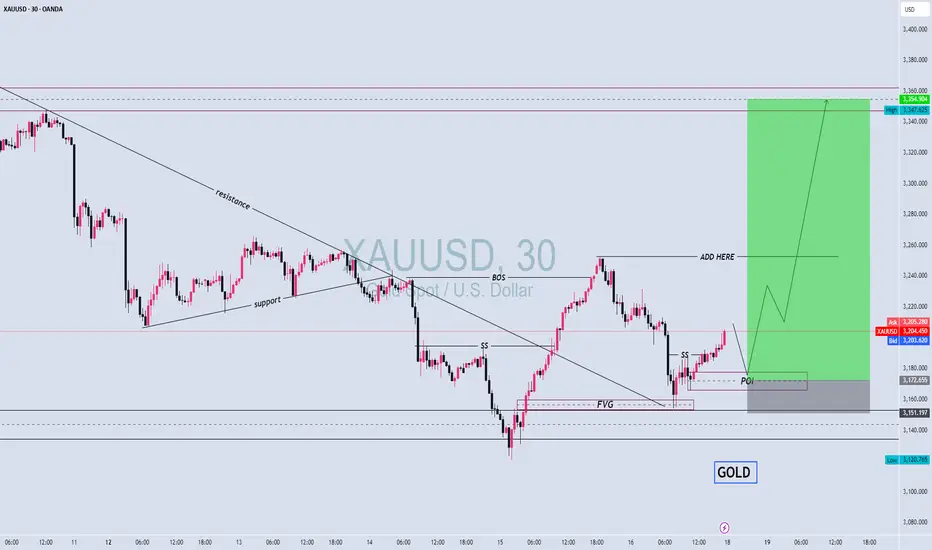
2. Current Market Context – 30M Chart Breakdown
From your chart:
• After bottoming at 3119.24, price broke short-term structure (SS) → rallied →
pulled back to mitigate FVG at 3160–3175 zone.
• This mitigation created a strong Point of Interest (POI), aligned across 1H, 30M,
15M, 5M FVGs.
• The current retracement into that POI is setting up a bullish continuation.
Fair Value Gaps (FVGs) represent inefficient price movement (imbalances) that are
often filled before continuation. Once filled, they act as demand or supply.
3. Key Technical Zones & Why They Matter
Zone/Level Type
Why It Matters
3500.20
ATH
Long-term TP zone. Start of entire downtrend
3431.25
Macro Resistance 2nd touch of descending trendline
3343.05
Previous High
TP1 level. Strong reaction expected
3240.13 –
3260
Add Position Zone Previous internal resistance broken. Confirmed demand after
breakout
3175 – 3160 POI / Entry Zone
MTF FVG + demand + origin of last strong bullish leg
3119.24
SL Invalidation
Zone
Last lowest low. Break below here invalidates the setup
4. Execution Plan – How to Trade This Setup
Primary Entry (Buy Limit or LTF Confirmation):
• Entry Zone: 3175 – 3160 (POI)
• Confirmation Entry: Look for bullish price action on 5M–15M:
o Bullish engulfing candle
o Internal BOS on LTF
o Rejection wick from POI
• SL Options:
o Conservative: Below 3119.24 (hard invalidation)
o Aggressive: Below 3149.50, just under the POI
Scale-In/Add Zone:
• Price: 3240.13 – 3260
• Condition: Wait for a clean break and retest
• Why? This zone acted as strong resistance in the past and will confirm buyer
strength once retested successfully.
5. Target Levels (Profit-Taking Zones)
Target
Level
Reason
TP1
3343.05 First structure high
TP2
3431.25 Second macro trendline touch
TP3 (Final)
3500.20 ATH, end of descending channel
6. Risk-Reward Management
Strategy
Entry SL
Target
Conservative
e
RRR (TP1–TP3)
3165 3119.24 3343.05+ 3:1 to 6:1
Aggressive
3165 3149.50 3343.05+ 4:1 to 8:1
Only risk capital you're willing to lose
If POI fails and price breaks 3119.24 → invalidate the long bias
7. Confluences – Why This Trade Is Strong
• Multiple Structure Shifts (SS) confirmed bullish reversal
• Break of Structure (BOS) shows change in momentum
• FVG mitigation = smart money entry zone
• Internal trendline was broken = bearish structure failing
• Demand aligned across 4 timeframes (1H → 5M)
• Clean RRR for both conservative and aggressive styles
We are seeing signs of a potential trend reversal or major correction on Gold, with
clear structure shifts and bullish momentum building up after a deep corrective move
inside a larger descending channel. This plan is built around an entry from a key
demand zone formed after a break of structure (BOS) and mitigation of Fair Value
Gaps (FVGs) across multiple timeframes.
1. Market Story (Structure Summary)
Gold has been moving inside a downward sloping channel, defined by lower highs and
lower lows:
Trend Element Price Level
Reason
1st High (ATH)
2nd High
Lower Highs
Lower Lows
3500.20
3431.25
Start of macro descending
trendline
2nd touch, validating resistance
3412.02 → 3345.70 → 3240.13 Confirmed downtrend structure
3269.31 → 3201.43 → 3119.24 Bearish structure continuation
From this point, price found demand at 3119.24 and aggressively broke:
• Internal descending trendline (showing loss of bearish control)
• Previous structural resistance at 3191.00 (now support)
• Multiple Structure Shifts (SS) and a BOS, signaling a bullish transition
Summary: The downtrend structure is weakening. Price is breaking internal
resistances and making higher highs/lows.
2. Current Market Context – 30M Chart Breakdown
From your chart:
• After bottoming at 3119.24, price broke short-term structure (SS) → rallied →
pulled back to mitigate FVG at 3160–3175 zone.
• This mitigation created a strong Point of Interest (POI), aligned across 1H, 30M,
15M, 5M FVGs.
• The current retracement into that POI is setting up a bullish continuation.
Fair Value Gaps (FVGs) represent inefficient price movement (imbalances) that are
often filled before continuation. Once filled, they act as demand or supply.
3. Key Technical Zones & Why They Matter
Zone/Level Type
Why It Matters
3500.20
ATH
Long-term TP zone. Start of entire downtrend
3431.25
Macro Resistance 2nd touch of descending trendline
3343.05
Previous High
TP1 level. Strong reaction expected
3240.13 –
3260
Add Position Zone Previous internal resistance broken. Confirmed demand after
breakout
3175 – 3160 POI / Entry Zone
MTF FVG + demand + origin of last strong bullish leg
3119.24
SL Invalidation
Zone
Last lowest low. Break below here invalidates the setup
4. Execution Plan – How to Trade This Setup
Primary Entry (Buy Limit or LTF Confirmation):
• Entry Zone: 3175 – 3160 (POI)
• Confirmation Entry: Look for bullish price action on 5M–15M:
o Bullish engulfing candle
o Internal BOS on LTF
o Rejection wick from POI
• SL Options:
o Conservative: Below 3119.24 (hard invalidation)
o Aggressive: Below 3149.50, just under the POI
Scale-In/Add Zone:
• Price: 3240.13 – 3260
• Condition: Wait for a clean break and retest
• Why? This zone acted as strong resistance in the past and will confirm buyer
strength once retested successfully.
5. Target Levels (Profit-Taking Zones)
Target
Level
Reason
TP1
3343.05 First structure high
TP2
3431.25 Second macro trendline touch
TP3 (Final)
3500.20 ATH, end of descending channel
6. Risk-Reward Management
Strategy
Entry SL
Target
Conservative
e
RRR (TP1–TP3)
3165 3119.24 3343.05+ 3:1 to 6:1
Aggressive
3165 3149.50 3343.05+ 4:1 to 8:1
Only risk capital you're willing to lose
If POI fails and price breaks 3119.24 → invalidate the long bias
7. Confluences – Why This Trade Is Strong
• Multiple Structure Shifts (SS) confirmed bullish reversal
• Break of Structure (BOS) shows change in momentum
• FVG mitigation = smart money entry zone
• Internal trendline was broken = bearish structure failing
• Demand aligned across 4 timeframes (1H → 5M)
• Clean RRR for both conservative and aggressive styles
Disclaimer
The information and publications are not meant to be, and do not constitute, financial, investment, trading, or other types of advice or recommendations supplied or endorsed by TradingView. Read more in the Terms of Use.
Disclaimer
The information and publications are not meant to be, and do not constitute, financial, investment, trading, or other types of advice or recommendations supplied or endorsed by TradingView. Read more in the Terms of Use.