Gold is heading into September after a monster run in 2024/25. Unlike the “September slump” you hear about in crypto, gold’s last decade shows mostly mild, tactical moves in September—often driven by real yields, the dollar, and physical demand cycles. Once any early-month wobble plays out, dips have tended to be opportunities within the prevailing trend.
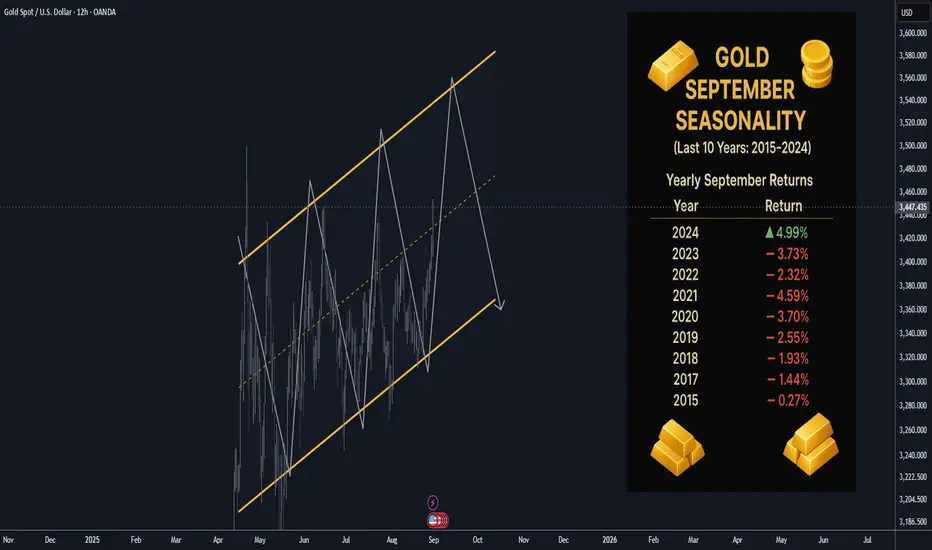
📊 Gold September Seasonality (Last 10 Years: 2015–2024)
Yearly September Returns
Year 📈 Return
2024 🟢 +4.99%
2023 🔴 −3.73%
2022 🔴 −2.32%
2021 🔴 −4.59%
2020 🔴 −3.70%
2019 🔴 −2.55%
2018 🔴 −1.93%
2017 🔴 −1.44%
2016 🟢 +1.02%
2015 🔴 −0.27%
📌 At-a-glance stats (2015–2024)
📉 Mean (10-yr): −1.45%
⚖️ Median: −2.13%
🔴 Red months: 8 out of 10
❌ Worst September: 2021 (−4.59%)
✅ Best September: 2024 (+4.99%)
📅 Recent Performance (last 3 years)
2024: 🟢 +4.99% → strongest September in the set
2023: 🔴 −3.73% → higher real yields weighed on bullion
2022: 🔴 −2.32% → strong USD + aggressive Fed hikes
➡️ Average of last 3 years: 🔴 −0.35%
➡️ Average of last 5 years (2020–2024): 🔴 −1.87%
________________________________________
🔎 Key Insights
• Gentle September bias: Over the last decade, September has skewed slightly negative for gold (mean −1.45%), but the drawdowns are modest compared to risk assets.
• Cycle matters more than calendar: 2020–2023 saw consistent reds as the dollar firmed and real yields rose; 2024 flipped green as rate-cut expectations and central-bank demand underpinned prices.
• Long-term seasonality ≠ last-decade reality: Multi-decade studies often show gold firming into late summer/early autumn (festival/jewelry demand, restocking), but the last 10 years were dominated by policy and yields—diluting that classic pattern.
________________________________________
🚀 Macro & Market Context
• 2019–2020: Trade tensions into COVID—gold corrected in Sep ’19 (−2.6%) and more so in Sep ’20 (−3.7%) after August’s spike to new highs.
• 2021: Fed taper talk + rising real yields → weakest September (−4.6%).
• 2022: King Dollar & rapid hikes → another red September (−2.3%).
• 2023: Real yields kept pressure on bullion (−3.7%).
• 2024: Sentiment flipped on policy expectations and persistent central-bank demand → solid +5.0% September.
________________________________________
🧭 Takeaway
Gold’s September over the last decade has leaned slightly bearish, but mostly in controlled, single-digit moves. The signal isn’t “sell September,” it’s “watch real yields, the USD, and physical flows.” When those line up, the calendar fade loses its bite—as 2024 showed.
Note
Blueprint to Becoming a Successful Gold Trader in 2025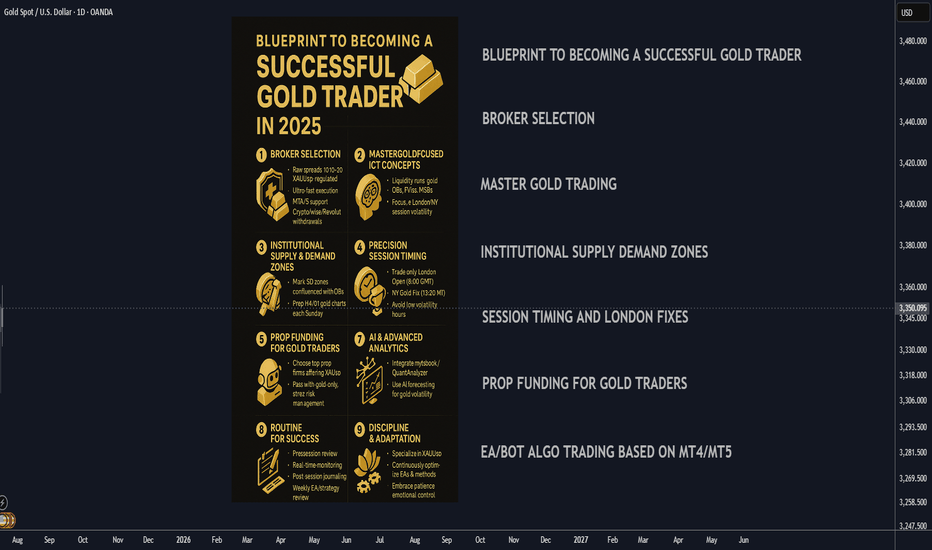
Note
Gold Prices Overview of Primary Catalyst : September 2025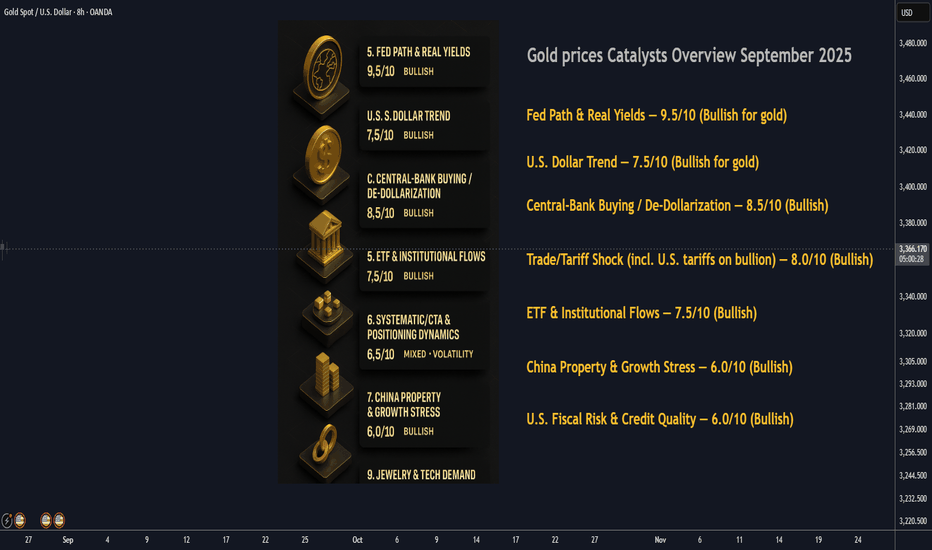
Note
taplink.cc/black001
🔱Syndicate Black MT4/MT5
⚡️Gold/FX Auto-Trading bot
🔱100%/week max DD <10%
📕verified 500%+ gains
🏧GOLD EA target 100%+ gains/week
🚀supercharge your trading
💎75% win rate gold signals
t.me/syndicategold001
🔱Syndicate Black MT4/MT5
⚡️Gold/FX Auto-Trading bot
🔱100%/week max DD <10%
📕verified 500%+ gains
🏧GOLD EA target 100%+ gains/week
🚀supercharge your trading
💎75% win rate gold signals
t.me/syndicategold001
Related publications
Disclaimer
The information and publications are not meant to be, and do not constitute, financial, investment, trading, or other types of advice or recommendations supplied or endorsed by TradingView. Read more in the Terms of Use.