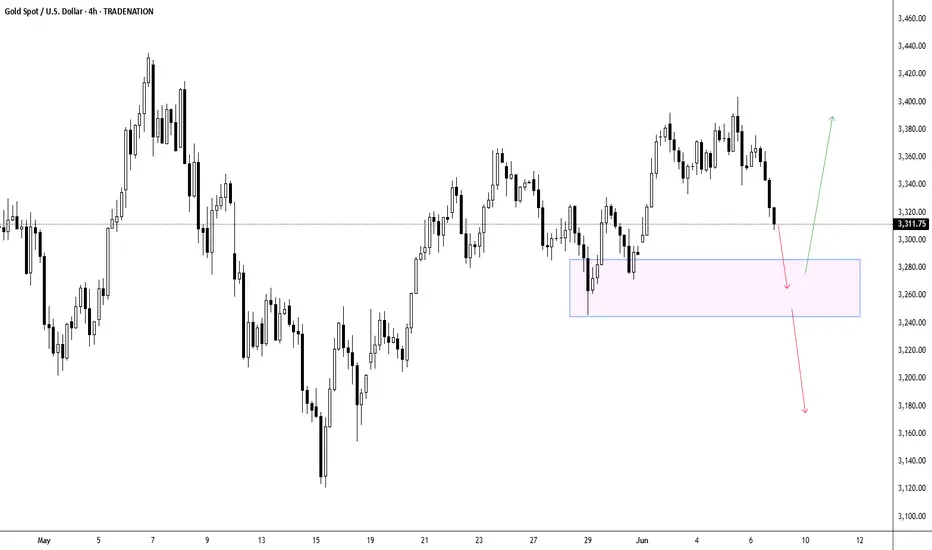
Looking at this Gold 4-hour chart, the precious metal is approaching a critical inflection point as it tests the key support zone around $3,260, which represents a confluence of previous swing lows and represents the lower boundary of the recent consolidation range. Two distinct scenarios emerge from this technical setup: first, gold could find buyers at this support level and stage a bounce back toward the $3,400 resistance area, particularly if broader market conditions favor safe-haven assets or if dollar weakness provides additional tailwinds for the metal. Alternatively, a decisive break below the $3,260 support could trigger further selling pressure and open the door for a deeper correction toward the $3,180-$3,160 zone, especially if risk appetite improves or if stronger economic data reduces demand for defensive assets. The outcome will largely depend on how price action unfolds at this crucial support level, with volume and momentum providing key clues about which scenario is more likely to play out in the near term.
Disclosure: I am part of Trade Nation's Influencer program and receive a monthly fee for using their TradingView charts in my analysis.
Disclosure: I am part of Trade Nation's Influencer program and receive a monthly fee for using their TradingView charts in my analysis.
Disclaimer
The information and publications are not meant to be, and do not constitute, financial, investment, trading, or other types of advice or recommendations supplied or endorsed by TradingView. Read more in the Terms of Use.
Disclaimer
The information and publications are not meant to be, and do not constitute, financial, investment, trading, or other types of advice or recommendations supplied or endorsed by TradingView. Read more in the Terms of Use.