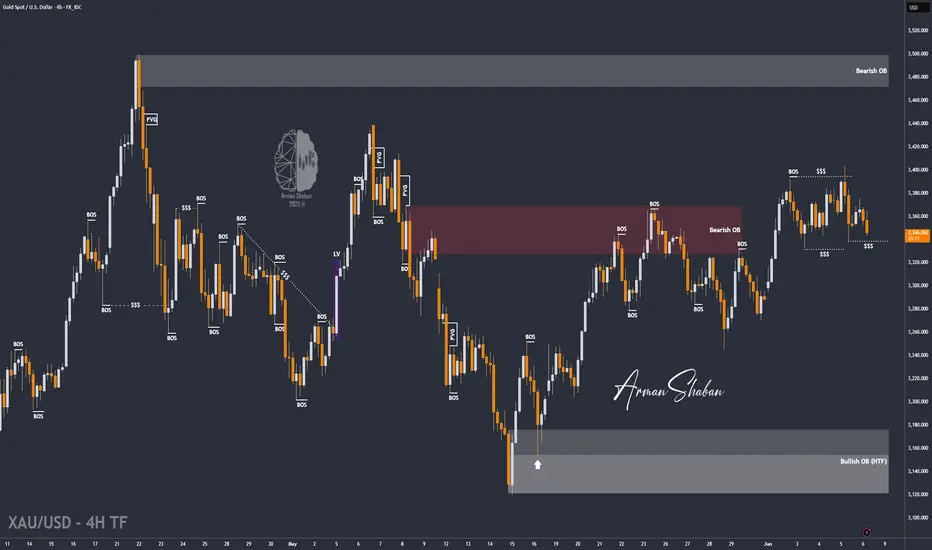
By examining the gold chart on the 4-hour timeframe, we can see that after our previous analysis, the price climbed to $3388, giving us nearly 150 pips of return. However, gold was rejected from that level and failed to hold above $3370, eventually dropping below $3360.
Currently, gold is trading around $3348, and we may likely see further decline toward lower levels. The potential downside targets are $3338, $3332, $3326, and $3317.
Key demand zones to watch are:
→ $3327
→ $3311
→ $3298–$3300
→ $3278
Please support me with your likes and comments to motivate me to share more analysis with you and share your opinion about the possible trend of this chart with me !
Best Regards , Arman Shaban
Trade active
Gold has shown clear signs of weakness after failing to hold above the $3370 resistance level. The rejection from $3388 followed by a drop below $3360 suggests that bullish momentum has faded in the short term.The structure now leans bearish, with price currently trading around $3348 and pressing lower. This move also indicates that previous buy-side liquidity has likely been absorbed, opening room for a deeper retracement into key demand zones.
🔍 Technical Bias:
Bearish below $3360, with potential for further decline if $3338 breaks cleanly.
📉 Invalidation Level:
A strong 4H close above $3370 would invalidate the short-term bearish bias and may shift momentum back to the upside.
🎯 Bearish Targets:
• $3338 – minor support
• $3332 – recent price reaction level
• $3326 – structural demand
• $3317 – liquidity sweep zone
📊 Key Demand Zones:
• $3327 – near-term reaction zone
• $3311 – mid-level demand
• $3298–$3300 – major consolidation support
• $3278 – key structural zone and potential reversal area
🧠 Extra Insight:
If price reaches into the $3298–$3300 zone with clear bullish divergence or rejection patterns on lower timeframes, it could offer high-probability long setups. Until then, the path of least resistance remains to the downside.
⚜️ Free Telegram Channel : t.me/PriceAction_ICT
⚜️ JOIN THE VIP : t.me/PriceAction_ICT/5946
⚜️ Contact Me : t.me/ArmanShabanTrading
💥Join BitMart Exchange – Ultra Low Fees : bitmart.com/invite/c5JVJK/en-US
⚜️ JOIN THE VIP : t.me/PriceAction_ICT/5946
⚜️ Contact Me : t.me/ArmanShabanTrading
💥Join BitMart Exchange – Ultra Low Fees : bitmart.com/invite/c5JVJK/en-US
Related publications
Disclaimer
The information and publications are not meant to be, and do not constitute, financial, investment, trading, or other types of advice or recommendations supplied or endorsed by TradingView. Read more in the Terms of Use.