Gold (XAU/USD) Market Analysis
Trend Environment
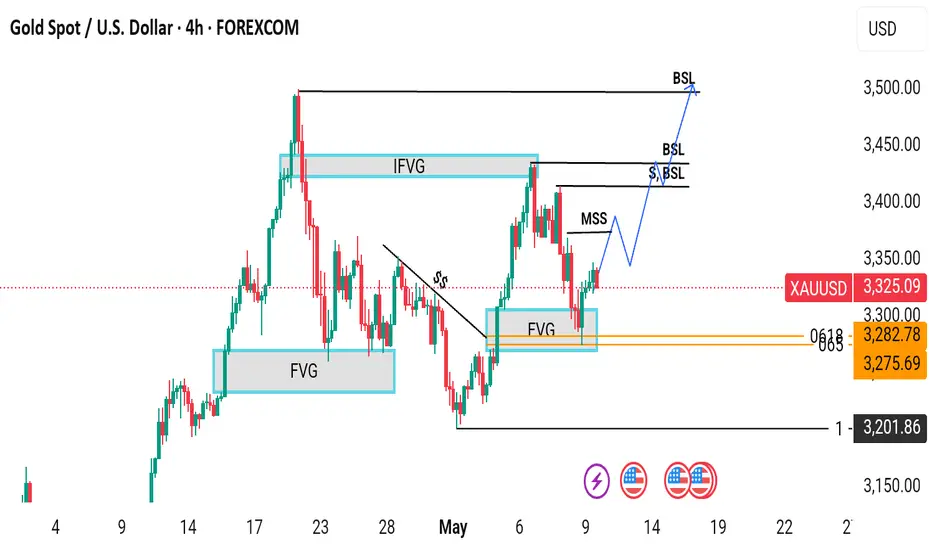
The 4-hour chart of Gold (XAU/USD) from OANDA illustrates a strong impulsive structure within a broader bullish trend. Following a sharp upward movement that broke through previous structure, gold formed a swing high before entering a corrective phase. The market has since pulled back and appears to be stabilizing near a zone of high confluence, suggesting potential for a renewed move to the upside.
Key Levels
Support Zone 3,280-3,300 region, characterized by a fair value gap and Fibonacci golden pocket zone (0.618-0.65 retracement levels).
Potential Targets Higher lows and break of structure above recent swing highs, with buy-side liquidity levels (BSL) marking areas where buy stops are likely to be clustered.
Technical Confluence
The alignment of the fair value gap and Fibonacci retracement levels in the 3,280-3,300 region increases the likelihood of price reacting positively. Fair value gaps represent inefficiencies in the market caused by strong institutional participation, while the golden pocket is historically known for acting as a magnet for reversals within trending markets.
Bullish Scenario
The chart projects a potential bullish continuation move, with a series of higher lows anticipated to form en route to a break of structure above recent swing highs. A methodical stair-step advance is expected, respecting interim levels before ultimately attempting to reach the prior high near 3,530.
Strategic Framework
This analysis offers a methodical roadmap for bullish continuation, rooted in the smart money framework of liquidity, inefficiency, and institutional order flow. The confluence between the fair value gap and Fibonacci retracement serves as a key validation area for bullish traders. By understanding the technical and institutional drivers of the market, traders can better navigate the complexities of the gold market and identify potential opportunities for growth.
Trend Environment
The 4-hour chart of Gold (XAU/USD) from OANDA illustrates a strong impulsive structure within a broader bullish trend. Following a sharp upward movement that broke through previous structure, gold formed a swing high before entering a corrective phase. The market has since pulled back and appears to be stabilizing near a zone of high confluence, suggesting potential for a renewed move to the upside.
Key Levels
Support Zone 3,280-3,300 region, characterized by a fair value gap and Fibonacci golden pocket zone (0.618-0.65 retracement levels).
Potential Targets Higher lows and break of structure above recent swing highs, with buy-side liquidity levels (BSL) marking areas where buy stops are likely to be clustered.
Technical Confluence
The alignment of the fair value gap and Fibonacci retracement levels in the 3,280-3,300 region increases the likelihood of price reacting positively. Fair value gaps represent inefficiencies in the market caused by strong institutional participation, while the golden pocket is historically known for acting as a magnet for reversals within trending markets.
Bullish Scenario
The chart projects a potential bullish continuation move, with a series of higher lows anticipated to form en route to a break of structure above recent swing highs. A methodical stair-step advance is expected, respecting interim levels before ultimately attempting to reach the prior high near 3,530.
Strategic Framework
This analysis offers a methodical roadmap for bullish continuation, rooted in the smart money framework of liquidity, inefficiency, and institutional order flow. The confluence between the fair value gap and Fibonacci retracement serves as a key validation area for bullish traders. By understanding the technical and institutional drivers of the market, traders can better navigate the complexities of the gold market and identify potential opportunities for growth.
Join My Telegram Channel For Getting Free Signals and Analysis 👇👇
t.me/fxinsighthub7
t.me/fxinsighthub7
Disclaimer
The information and publications are not meant to be, and do not constitute, financial, investment, trading, or other types of advice or recommendations supplied or endorsed by TradingView. Read more in the Terms of Use.