🌀 Elliott Wave Structure
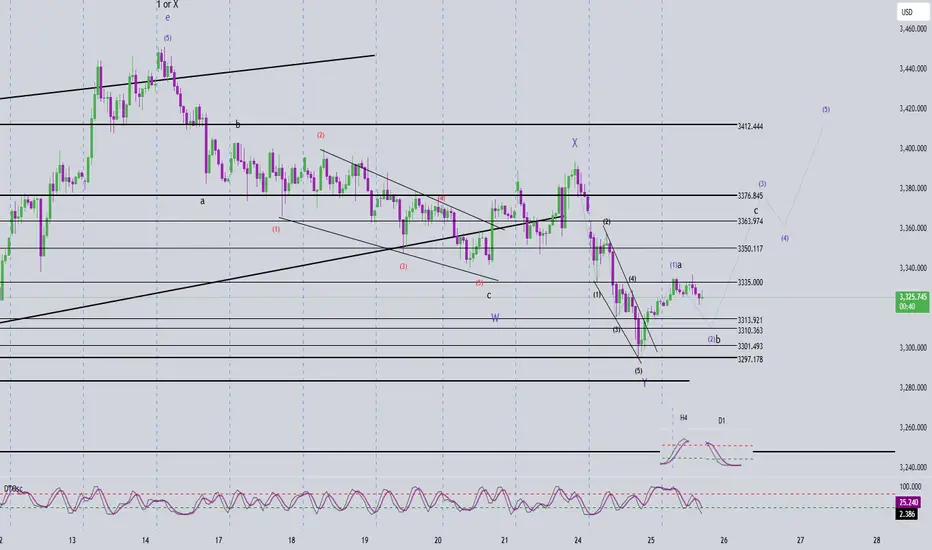
Looking at the H1 chart, we can see a 5-wave black triangle structure has formed within wave Y. This suggests two possible scenarios:
Scenario 1: Wave Y has completed → the current upward move is wave 1 of a new 5-wave green structure. The ongoing pullback would then be wave 2 of this sequence.
Scenario 2: Wave A of wave Y has completed as a 5-wave move → we are now in wave B of wave Y, which typically forms a 3-wave pattern. In this case, wave a (black) has formed and wave b (black) is currently developing.
✅ In both scenarios, the ongoing decline is a shared element — representing a buying opportunity.
🎯 Key Target Zones
Target 1: 3313 – 3310
Target 2: 3301
⚠️ If price breaks below 3297, the current wave count is invalidated, and we must prepare for a deeper correction. Updates will follow if that happens.
🔁 Momentum Outlook
D1 Timeframe:
Momentum is about to reverse upward. We expect at least 5–6 days of bullish movement for D1 momentum to reach overbought territory ⇒ This supports a potential short-term uptrend and favors both bullish wave counts.
H4 Timeframe:
Momentum is about to reverse downward from the overbought zone → A further decline to our buy zones is likely.
H1 Timeframe:
Momentum is currently declining → The ongoing pullback is expected to continue.
📌 What to wait for: A bullish reversal in H1 momentum aligned with H4 in the oversold region will confirm the bottom is in.
✅ Trade Plan
🔹 BUY ZONE 1: 3313 – 3310
• SL: 3306
• TP1: 3335 | TP2: 3350 | TP3: 3376
🔹 BUY ZONE 2: 3303 – 3301
• SL: 3296
• TP1: 3335 | TP2: 3363 | TP3: 3376
Trade active
+100 pips Entry Buy 3313 - 3310Trade closed: target reached
+180 pips Buy 3313 - 3310Note
+300 Pips Buy 3313 - 3310👉 Join the channel to receive more scalping signals!
Channel Telegram: t.me/+XkFQ95yHVOEwNDc1
Channel Telegram: t.me/+XkFQ95yHVOEwNDc1
Related publications
Disclaimer
The information and publications are not meant to be, and do not constitute, financial, investment, trading, or other types of advice or recommendations supplied or endorsed by TradingView. Read more in the Terms of Use.
👉 Join the channel to receive more scalping signals!
Channel Telegram: t.me/+XkFQ95yHVOEwNDc1
Channel Telegram: t.me/+XkFQ95yHVOEwNDc1
Related publications
Disclaimer
The information and publications are not meant to be, and do not constitute, financial, investment, trading, or other types of advice or recommendations supplied or endorsed by TradingView. Read more in the Terms of Use.