Gold Spot (XAU/USD) Chart analysis
**Chart Overview**
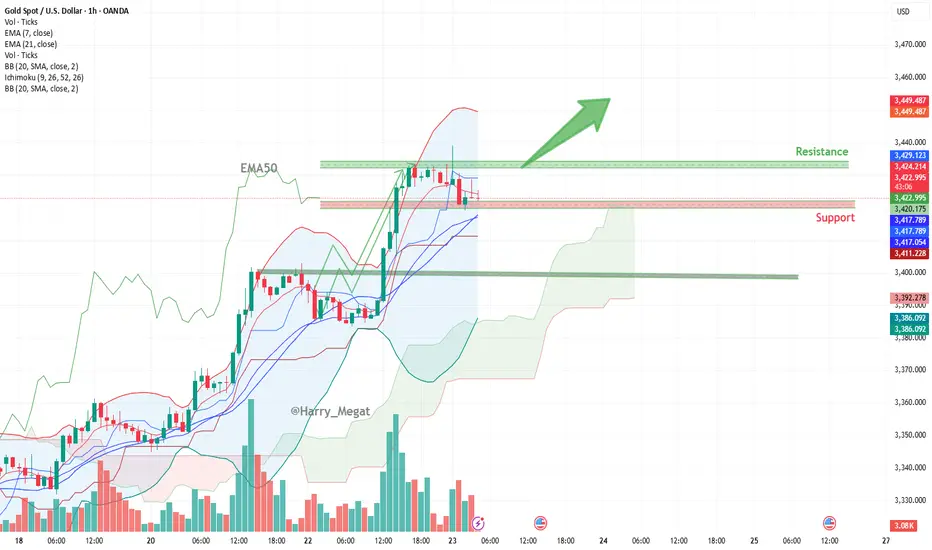
* **Current Price:** \~\$3,423.68
* **Recent Trend:** Bullish (Strong upward movement before recent consolidation)
* **Timeframe:** 1-hour chart
* **Indicators Used:**
* EMA 7 (Blue)
* EMA 21 (Purple)
* Bollinger Bands (Red/Green lines)
* Volume bars at bottom
**Bullish Momentum Signals**
1. **Strong Uptrend**:
* Price surged rapidly above \$3,400, breaking multiple resistance levels.
* Higher highs and higher lows confirm bullish structure.
2. **EMA Crossover**:
* The shorter-term EMA (7) is above the longer-term EMA (21), signaling a bullish bias.
* Price is currently near the EMAs, suggesting a possible retest of dynamic support.
3. **Bollinger Bands**:
* The price touched the **upper band**, indicating strong momentum.
* Bands are widening — a sign of increased volatility and continuation potential.
**Support and Resistance Zones**
* **Resistance Zone**: \~\$3,430–\$3,435
* Price was rejected here multiple times, indicating strong selling pressure.
* A breakout above this could send price toward the next level at \~\$3,450.
* **Support Zone**:
* Minor: \~\$3,417–\$3,418 (aligned with EMAs and lower Bollinger Band)
* Major: \~\$3,400 zone (previous breakout area and volume support)
**Bullish Setup**
* The **green arrow** suggests a bullish breakout is anticipated above \$3,430.
* If price holds above \$3,417 (EMA + BB support), the bulls could push it to **\$3,445–\$3,450** short-term.
**Risk**
* A break below \$3,417 and especially below \$3,400 could invalidate the bullish scenario and invite a correction.
* Watch for volume confirmation on any breakout to confirm strength.
**Conclusion**
Gold is in a **consolidation phase** after a strong rally. If support around \$3,417–\$3,418 holds, a breakout above \$3,430 could trigger a move to **\$3,445–\$3,450**. However, a break below EMAs would shift momentum back to neutral or bearish.
**Chart Overview**
* **Current Price:** \~\$3,423.68
* **Recent Trend:** Bullish (Strong upward movement before recent consolidation)
* **Timeframe:** 1-hour chart
* **Indicators Used:**
* EMA 7 (Blue)
* EMA 21 (Purple)
* Bollinger Bands (Red/Green lines)
* Volume bars at bottom
**Bullish Momentum Signals**
1. **Strong Uptrend**:
* Price surged rapidly above \$3,400, breaking multiple resistance levels.
* Higher highs and higher lows confirm bullish structure.
2. **EMA Crossover**:
* The shorter-term EMA (7) is above the longer-term EMA (21), signaling a bullish bias.
* Price is currently near the EMAs, suggesting a possible retest of dynamic support.
3. **Bollinger Bands**:
* The price touched the **upper band**, indicating strong momentum.
* Bands are widening — a sign of increased volatility and continuation potential.
**Support and Resistance Zones**
* **Resistance Zone**: \~\$3,430–\$3,435
* Price was rejected here multiple times, indicating strong selling pressure.
* A breakout above this could send price toward the next level at \~\$3,450.
* **Support Zone**:
* Minor: \~\$3,417–\$3,418 (aligned with EMAs and lower Bollinger Band)
* Major: \~\$3,400 zone (previous breakout area and volume support)
**Bullish Setup**
* The **green arrow** suggests a bullish breakout is anticipated above \$3,430.
* If price holds above \$3,417 (EMA + BB support), the bulls could push it to **\$3,445–\$3,450** short-term.
**Risk**
* A break below \$3,417 and especially below \$3,400 could invalidate the bullish scenario and invite a correction.
* Watch for volume confirmation on any breakout to confirm strength.
**Conclusion**
Gold is in a **consolidation phase** after a strong rally. If support around \$3,417–\$3,418 holds, a breakout above \$3,430 could trigger a move to **\$3,445–\$3,450**. However, a break below EMAs would shift momentum back to neutral or bearish.
Disclaimer
The information and publications are not meant to be, and do not constitute, financial, investment, trading, or other types of advice or recommendations supplied or endorsed by TradingView. Read more in the Terms of Use.
Disclaimer
The information and publications are not meant to be, and do not constitute, financial, investment, trading, or other types of advice or recommendations supplied or endorsed by TradingView. Read more in the Terms of Use.