Technical Analysis Chart Update
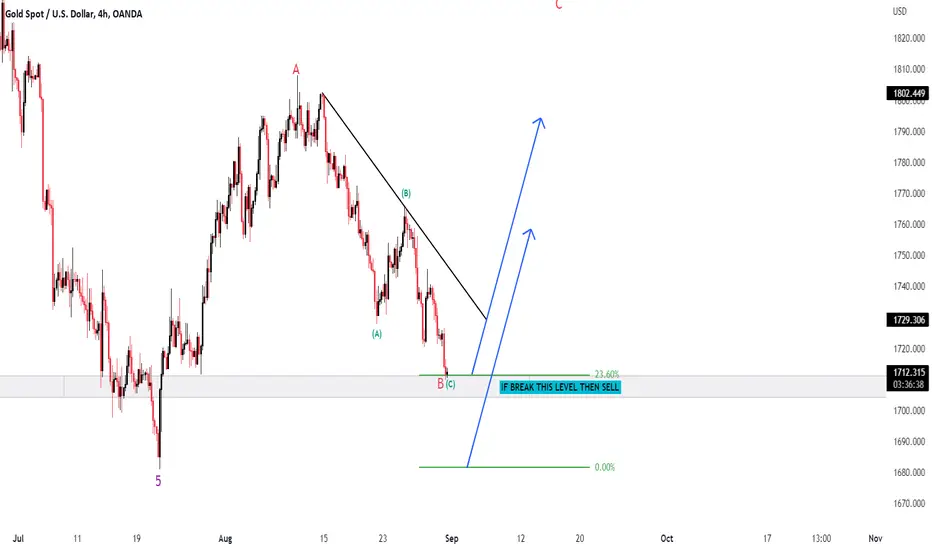
XAU / USD ( Gold / U.S Dollar )
Time Frame - H4
According to Daily Time Frame ( Long Term - #LTF ) we have ELLIOT WAVES
It has completed Impulsive waves and making Corrective wave " B "
It is currently standing at the Fibonacci Level - 23.80% If it breaks this Level then it will Follow Sell Trend
1708 - 13 is a Good Daily Support Level we need to wait until it Breaks or Reject this Level
Disclaimer
The information and publications are not meant to be, and do not constitute, financial, investment, trading, or other types of advice or recommendations supplied or endorsed by TradingView. Read more in the Terms of Use.
Disclaimer
The information and publications are not meant to be, and do not constitute, financial, investment, trading, or other types of advice or recommendations supplied or endorsed by TradingView. Read more in the Terms of Use.