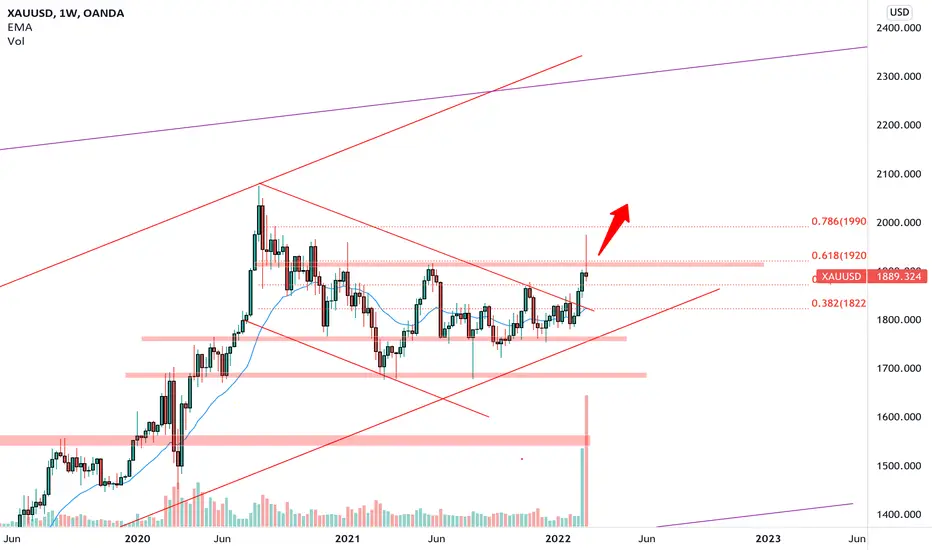
GOLD on the weekly chart is testing a weekly resistance level at the 1910.
The price has broken the descending weekly trendline showing us a market strength and the uncertain economic situation can create a new bull run on XAUUSD with a test of the previous historical high.
Amid inflation concerns and rising geopolitical conflict, the price of gold climbed to its highest level in about eight months. The price of gold futures briefly eclipsed $1,900 on Friday, marking a 6% increase from a recent low in late January.
I reckon the retracement near to the end of the week might be moved by the end of the February month and in my years of experience, the last week/ days of the month can provide unexpected and irregular price action moves.
How can we approach this scenario?
The bull pressure on the weekly resistance with high volumes can increase during this upcoming week and a break above that area will be a sign of strength.
We will monitor the price after the break and consider a long order if our Academy rules will be satisfied.
--––
Follow the Shrimp 🦐
Keep in mind.
🟣 Purple structure -> Monthly structure.
🔴 Red structure -> Weekly structure.
🔵 Blue structure -> Daily structure.
🟡 Yellow structure -> 4h structure.
⚫️ Black structure -> <4h structure.
Here is the Plancton0618 technical analysis , please comment below if you have any questions.
The ENTRY in the market will be taken only if the condition of the Plancton0618 strategy will trigger
Disclaimer
The information and publications are not meant to be, and do not constitute, financial, investment, trading, or other types of advice or recommendations supplied or endorsed by TradingView. Read more in the Terms of Use.
Disclaimer
The information and publications are not meant to be, and do not constitute, financial, investment, trading, or other types of advice or recommendations supplied or endorsed by TradingView. Read more in the Terms of Use.