Key Elements and Observations:
Price Action:
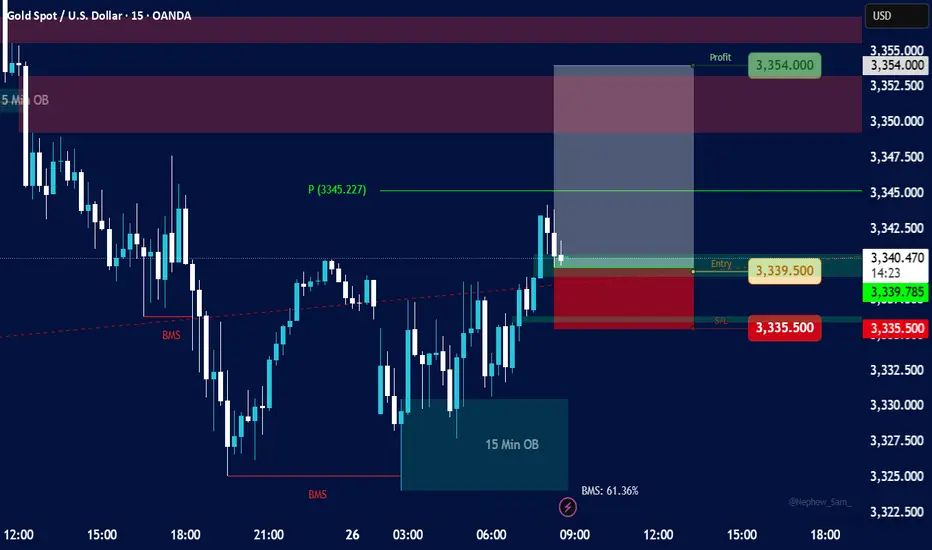
The price initially shows a downtrend, breaking below a previous low, indicated by "BMS" (likely "Break in Market Structure" or "Break of Market Structure").
Following the break, the price consolidates and then shows a strong upward movement, breaking above a resistance level, again marked by "BMS." This suggests a potential shift in momentum from bearish to bullish.
Order Blocks (OB):
5 Min OB (Blue Box, Top Left): There's a "5 Min OB" marked at a higher price level earlier in the chart. This represents a bearish order block, where significant selling pressure was previously observed.
15 Min OB (Teal Box, Bottom Right): A "15 Min OB" is identified at a lower price level (around 3326.00 - 3330.00). This is likely a bullish order block, indicating an area where institutions or large players placed buy orders, leading to a bounce in price.
Break in Market Structure (BMS):
Two "BMS" labels are visible:
The first BMS (red dashed line below 3330.00) indicates a break of a support level during the downtrend.
The second BMS (red dashed line above 3330.00) indicates a break of a resistance level during the subsequent uptrend, confirming a potential shift in market bias to bullish.
Entry, Stop Loss, and Take Profit (Trade Setup):
Entry (Green Line): The suggested entry point for a long (buy) position is at approximately 3339.50. This entry aligns with a retest of a previous resistance level that has now turned into support, or potentially the lower boundary of a small bullish order block or fair value gap.
Stop Loss (Red Line/Red Box): The stop loss is set at 3335.50. This is placed below a recent low or significant support level, specifically within a red-shaded area that likely represents a "Supply/Demand" zone or an area where the trade would be invalidated.
Take Profit (Green Line/Green Box): The take profit target is 3354.00, resulting in a "Profit" of 3354.00. This target is placed at a significant resistance level or an area where price might reverse. The white shaded box above the entry, extending to the take profit, highlights the potential profit zone.
Risk-Reward Ratio: While not explicitly calculated, the visual representation suggests a favorable risk-reward, with the potential profit (green box) appearing larger than the potential loss (red box).
Pivot Point (P):
A "P (3345.227)" is marked on the chart, likely indicating a pivot point, which can act as a dynamic support or resistance level. The current price is trading above this pivot point, further supporting a bullish bias.
"BMS: 61.36%" (Bottom Right):
This percentage likely refers to a "Break in Market Structure" metric or a specific trading indicator that quantifies the strength or probability of the market structure shift. 61.36% suggests a reasonably strong confirmation.
Implied Trading Strategy:
The chart depicts a bullish reversal strategy, likely based on "Smart Money Concepts" or "ICT" (Inner Circle Trader) principles. The strategy involves:
Identifying a shift in market structure: Price breaking highs after breaking lows, signaling a change from bearish to bullish.
Utilizing Order Blocks: Using the 15 Min OB as a foundational support level and potentially looking for entry confirmations around it.
Waiting for a Retest/Pullback: The entry around 3339.50 suggests waiting for a pullback after the initial bullish impulse. This could be a retest of a broken resistance level, a fair value gap (FVG), or a small bullish order block within the larger 15 Min OB.
Placing Stop Loss Strategically: Below a significant low or invalidation point.
Targeting Previous Highs/Resistance: Setting the take profit at a logical resistance level where previous selling pressure was observed.
Price Action:
The price initially shows a downtrend, breaking below a previous low, indicated by "BMS" (likely "Break in Market Structure" or "Break of Market Structure").
Following the break, the price consolidates and then shows a strong upward movement, breaking above a resistance level, again marked by "BMS." This suggests a potential shift in momentum from bearish to bullish.
Order Blocks (OB):
5 Min OB (Blue Box, Top Left): There's a "5 Min OB" marked at a higher price level earlier in the chart. This represents a bearish order block, where significant selling pressure was previously observed.
15 Min OB (Teal Box, Bottom Right): A "15 Min OB" is identified at a lower price level (around 3326.00 - 3330.00). This is likely a bullish order block, indicating an area where institutions or large players placed buy orders, leading to a bounce in price.
Break in Market Structure (BMS):
Two "BMS" labels are visible:
The first BMS (red dashed line below 3330.00) indicates a break of a support level during the downtrend.
The second BMS (red dashed line above 3330.00) indicates a break of a resistance level during the subsequent uptrend, confirming a potential shift in market bias to bullish.
Entry, Stop Loss, and Take Profit (Trade Setup):
Entry (Green Line): The suggested entry point for a long (buy) position is at approximately 3339.50. This entry aligns with a retest of a previous resistance level that has now turned into support, or potentially the lower boundary of a small bullish order block or fair value gap.
Stop Loss (Red Line/Red Box): The stop loss is set at 3335.50. This is placed below a recent low or significant support level, specifically within a red-shaded area that likely represents a "Supply/Demand" zone or an area where the trade would be invalidated.
Take Profit (Green Line/Green Box): The take profit target is 3354.00, resulting in a "Profit" of 3354.00. This target is placed at a significant resistance level or an area where price might reverse. The white shaded box above the entry, extending to the take profit, highlights the potential profit zone.
Risk-Reward Ratio: While not explicitly calculated, the visual representation suggests a favorable risk-reward, with the potential profit (green box) appearing larger than the potential loss (red box).
Pivot Point (P):
A "P (3345.227)" is marked on the chart, likely indicating a pivot point, which can act as a dynamic support or resistance level. The current price is trading above this pivot point, further supporting a bullish bias.
"BMS: 61.36%" (Bottom Right):
This percentage likely refers to a "Break in Market Structure" metric or a specific trading indicator that quantifies the strength or probability of the market structure shift. 61.36% suggests a reasonably strong confirmation.
Implied Trading Strategy:
The chart depicts a bullish reversal strategy, likely based on "Smart Money Concepts" or "ICT" (Inner Circle Trader) principles. The strategy involves:
Identifying a shift in market structure: Price breaking highs after breaking lows, signaling a change from bearish to bullish.
Utilizing Order Blocks: Using the 15 Min OB as a foundational support level and potentially looking for entry confirmations around it.
Waiting for a Retest/Pullback: The entry around 3339.50 suggests waiting for a pullback after the initial bullish impulse. This could be a retest of a broken resistance level, a fair value gap (FVG), or a small bullish order block within the larger 15 Min OB.
Placing Stop Loss Strategically: Below a significant low or invalidation point.
Targeting Previous Highs/Resistance: Setting the take profit at a logical resistance level where previous selling pressure was observed.
Trade active
enter again same current price : 3336 with stop lose 3334.50Trade closed: target reached
try to close at entry Disclaimer
The information and publications are not meant to be, and do not constitute, financial, investment, trading, or other types of advice or recommendations supplied or endorsed by TradingView. Read more in the Terms of Use.
Disclaimer
The information and publications are not meant to be, and do not constitute, financial, investment, trading, or other types of advice or recommendations supplied or endorsed by TradingView. Read more in the Terms of Use.