1. Analysis of core driving factors
Short-term bearish factors
The dollar rebounded: the US dollar index rebounded from a 6-week low, suppressing gold prices.
Risk sentiment warmed up: risk assets such as stocks rose, weakening safe-haven demand, and some longs took profits and left the market.
Medium- and long-term bullish support
Geopolitical risks (no progress in the Russian-Ukrainian conflict, escalating Sino-US trade frictions)
Federal Reserve dovish expectations
US fiscal deficit expansion (long-term weakening of US dollar credit, good for gold)
Key event guidance
Friday's non-agricultural data: If the employment data is weaker than expected, it may strengthen the Fed's expectations of rate cuts, which is good for gold; on the contrary, if the data is strong, the US dollar may rebound and gold will be under pressure.
2. Technical key signals (1-hour chart)
✅ Moving average system: 1-hour MA5/MA10 golden cross, short-term trend is bullish.
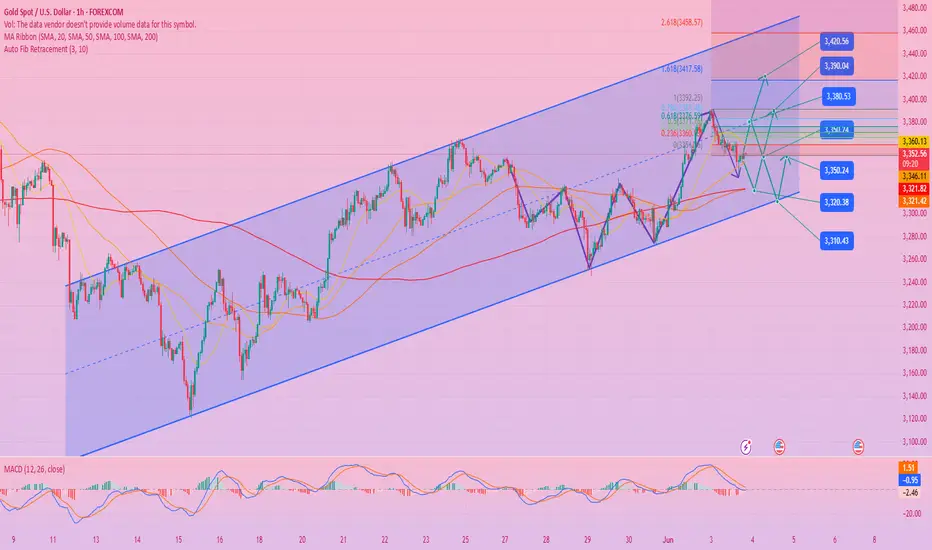
✅ Key support: 3333 (strong rebound after Tuesday's pullback, long defensive position).
✅ Key resistance: 3370-3380 (if broken, it will go up to the 3400 psychological level).
⚠️ Risk warning: If it falls below 3350, it may fall back to the support zone of 3330-3320, and we need to be alert to the weakening trend.
III. Today's gold trading strategy
1. Main strategy: long on pullback (follow the trend)
Ideal entry point: 3320-3325 (intervene after confirming support after falling back).
Stop loss: below 3310 (to prevent false breakthroughs).
Target: 3370-3380 (first target), look at 3400 after breaking through.
2. Secondary strategy: short on rebound (cautious operation)
Trigger condition: the price touches 3380 for the first time and there is a stagflation signal (such as a long upper shadow line, MACD top divergence).
Stop loss: above 3385 (strict risk control).
Target: 3360-3355 (quick entry and exit).
4. Change signals that need to be paid attention to
Break above 3380: It may accelerate to 3400, and short orders should be avoided.
Falling below 3340-3350: Be wary of a waterfall-like plunge and pay attention to the support area of 3330-3320 below.
Non-agricultural outlook: ADP data on Thursday may trigger fluctuations in advance, and it is recommended to deal with it with a light position.
5. Summary and suggestions
Overall thinking: The short-term trend is still bullish, but we need to be wary of the risk of callback brought by the rebound of the US dollar.
Best opportunity: Wait for a retracement to stabilize near 3320 and then buy low and buy more, and avoid chasing the rise.
Risk control: Strictly stop loss, reduce positions before non-agricultural data to prevent data shocks.
Trade active
ADP data impact: The US "small non-farm" data in May was significantly lower than expected (37,000 new vs. 110,000 expected), strengthening the market's bet on the Fed's interest rate cut, the US dollar was under pressure (falling below the 99 mark), US Treasury yields fell, and gold was supported as a safe-haven asset.
Technical signal: The bottoming pattern of gold daily line was confirmed, and the low point gradually moved up (3344→3350). The short-term bulls were strong, but attention should be paid to the breakthrough of the previous high of 3392 pressure level.
Non-farm outlook: If the non-farm data continues to be weak on Friday, gold may accelerate its rise; if it rebounds beyond expectations, the US dollar may rebound in the short term, and gold faces the risk of a correction.
Technical analysis
Key price
Support: 3344-3350 (intraday low and early long order entry, long defense line)
Resistance: 3385-3392 (Wednesday high and early week suppression, breakthrough opens up upside)
Bull-bear watershed: If gold price stands above 3392, the target is 3420-3450; if it loses 3344, the risk of short-term correction increases.
Form and momentum
15-minute chart: The big positive line rises with large volume, showing strong bullish momentum, but be wary of the decline in the latter part of the US market (3384→3360).
4-hour chart: MACD golden cross continues, RSI is close to the overbought zone, there may be short-term fluctuations, but the trend is still bullish.
Operation strategy suggestions:
Day trading (June 5)
Long strategy
Entry point: Long with a light position when the price falls back to 3355-3360, and those who are conservative will wait for the area around 3345 to increase their positions.
Stop loss: below 3340 (to prevent false breakthroughs).
Target: 3380-3385 (reduce half position), and look at 3400-3420 after breaking through 3392.
Short strategy (cautious)
Entry point: Try short with a light position when the price first touches 3390-3392 (needs a quick fall signal).
Stop loss: above 3395.
Target: 3375-3365 (short-term speculation callback).
Mid-term layout: If the gold price stabilizes at 3400 after the non-agricultural data, you can arrange long orders with the target at 3450-3480.
Market sentiment and risk warning
Disagreement among retail investors: Some traders bet on continued weakness in non-agricultural data and arrange long orders in advance; other funds are waiting for the direction to be confirmed after the data is released.
Institutional trends: Pay attention to the policy signals before the Fed's June interest rate meeting. If the employment data continues to weaken, the probability of a rate cut in September may rise to more than 50%.
Risk events:
Non-agricultural data deviates from expectations (especially the unemployment rate and wage growth rate).
Geopolitics or unexpected hawkish remarks by Fed officials may disturb the market.
Summary
Gold's short-term technical and fundamental aspects are bullish, but we need to be wary of profit-taking before non-agricultural data. Trading discipline: Strictly stop loss, stop profit in batches, and avoid heavy bets on data. If the Asian and European sessions maintain a consolidation above 3360, the US session can choose to follow up with breakthrough long orders.
Key question to think about: If the non-agricultural data is stronger than expected, where is the limit of gold's correction?
Potential answer: 3300-3320 area (previous platform support + daily level trend line), then you can observe the stabilization signal and re-arrange long positions.
Related publications
Disclaimer
The information and publications are not meant to be, and do not constitute, financial, investment, trading, or other types of advice or recommendations supplied or endorsed by TradingView. Read more in the Terms of Use.
Related publications
Disclaimer
The information and publications are not meant to be, and do not constitute, financial, investment, trading, or other types of advice or recommendations supplied or endorsed by TradingView. Read more in the Terms of Use.