On the 4H charts gold is in a clear uptrend, printing higher highs and higher lows. If we manage to get a rally higher from this level, a higher high can be expected, while a potential bearish butterfly completion is sitting at 1765.
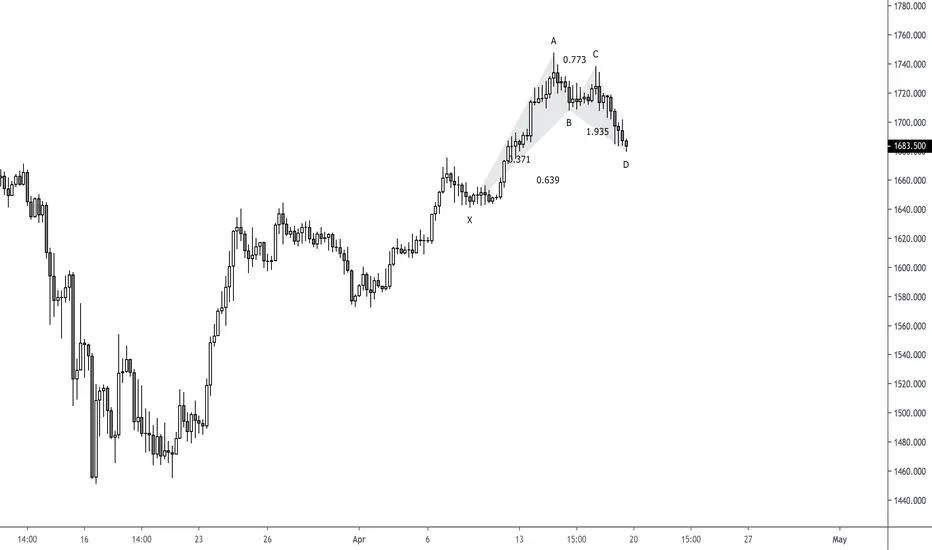
There is a good chance that gold might reverse from this level. A bullish Gartley is appearing, in which 38.2%, 61.8%, 78.6% fibonacci retracements sets up a nice symmetrical pattern with a 200% extension. The pattern completes between 1.414 and 1.618 AB=CD. Some strong support should be expected at the 1.618 level at 1675 with demand sitting just above with a fibonacci cluster consisting of 23.6% retracement and the 200% extension at 1678.

A 15 minute chart is showing bullish divergences and confirms the long bias:

Good luck to all trading gold!!
There is a good chance that gold might reverse from this level. A bullish Gartley is appearing, in which 38.2%, 61.8%, 78.6% fibonacci retracements sets up a nice symmetrical pattern with a 200% extension. The pattern completes between 1.414 and 1.618 AB=CD. Some strong support should be expected at the 1.618 level at 1675 with demand sitting just above with a fibonacci cluster consisting of 23.6% retracement and the 200% extension at 1678.
A 15 minute chart is showing bullish divergences and confirms the long bias:
Good luck to all trading gold!!
Note
Completely missed the other AB=CD.. First target hit at 1680... Could be heading down to second target at 38.2%Note
Note
Price and momentum starting to converge. A quick view on the 4h charts shows that price is unable to close below the 1.618 level plotted on the chart
Disclaimer
The information and publications are not meant to be, and do not constitute, financial, investment, trading, or other types of advice or recommendations supplied or endorsed by TradingView. Read more in the Terms of Use.
Disclaimer
The information and publications are not meant to be, and do not constitute, financial, investment, trading, or other types of advice or recommendations supplied or endorsed by TradingView. Read more in the Terms of Use.