On Tuesday (June 17), spot gold once reached above $3,400 during the Asian session, then fell slightly during the European session, and maintained a high-level volatile trend during the session. Earlier on Monday, gold recorded its largest single-day drop in a month (1.4%). After the sudden outbreak in the Middle East and US President Trump's warning to Tehran, the market's risk aversion demand heated up again, pushing gold prices to rebound in the Asian session. The two-day interest rate meeting of the Federal Reserve has also become a top priority for the market.
Fundamentals
Tensions in the Middle East have heated up again. According to Reuters, Israel's air strikes on Iran's state-run TV station, Iran's threats to launch the most violent missile attack in history, and the fire of three oil tankers near the Strait of Hormuz have caused market concerns about the escalation of geopolitical conflicts. US President Trump left the G7 summit early and convened a national security meeting, which increased market risk aversion.
At the same time, ETF holdings increased significantly. Data showed that ETFs increased their holdings of gold by 136,000 ounces on the previous trading day, and the net purchase volume has reached 6 million ounces this year, reflecting that funds still have strong confidence in the future of gold. SPDR Gold ETF even recorded a single-day net inflow of $285 million last Friday, the largest in weeks.
In terms of the US macroeconomics, the market generally expects the Fed to keep interest rates unchanged this week, but the focus is on Powell's speech and changes in the dot plot. As expectations of further rate cuts in 2025 heat up, the US dollar is still under pressure close to a three-year low, and analysts believe that this will form a structural support for gold in the medium term.
Technical aspects:
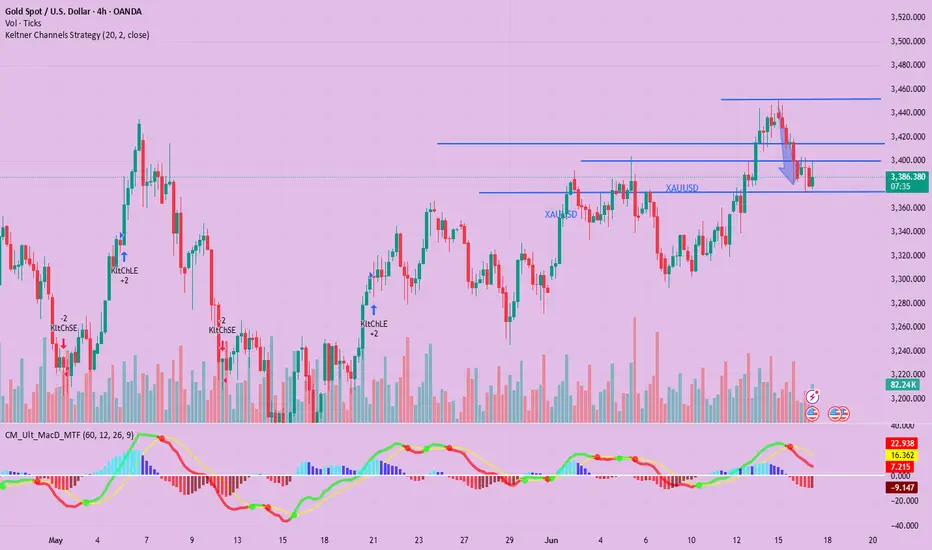
The gold daily candlestick chart shows that the current trend is in a typical "rising wedge" pattern. Prices have been steadily rising along an upward trend line this year, while the upper side is suppressed by strong resistance in the 3450-3500 area. The current market is in a wait-and-see state.
There are obvious signs of Bollinger Bands closing, with the upper Bollinger track at $3440.63, the middle Bollinger track at $3317.51, and the lower track has moved up to around $3194.38, reflecting that the market is brewing a breakthrough. The current price is basically running between the upper and middle Bollinger tracks, indicating that it is still in a bullish structure, but once it falls below the middle Bollinger track or the lower edge of the wedge (about $3,330), it may trigger accelerated downside risks. The RSI indicator remains at 55.79, neutral to strong, and has not entered the overbought area.
Comprehensively judged, the analysis believes that the short-term trend is in consolidation, and be alert to the risk of technical reversal. If the support of $3,330 is lost, further downside space will be opened; on the upside, it needs to break through the pressure range of $3,450 before trying the previous high of $3,499.83.
Market sentiment observation
The current gold market sentiment is in a "highly sensitive" stage. On the one hand, risk aversion once pushed gold to rebound rapidly, reflecting that the market has a very high pricing sensitivity to geopolitical risks; on the other hand, traders are still uncertain about the outlook for the Fed's policy, and the expectation that interest rates will remain unchanged has been fully priced in, but there are large differences in the future path of interest rate cuts.
The weak rebound of the US dollar shows that the market does not fully agree with the logic of "hawkish stability maintenance". This contradictory sentiment has caused gold to fluctuate at a high level and has not yet formed a trend breakthrough. The continued increase in ETF holdings provides substantial buying support for gold, which constitutes the optimistic support of the "underlying logic".
In addition, the market is still waiting for the FOMC meeting to release new signals. This "uncertain outlook" constitutes a typical "cautious optimism" market psychology. Traders are more likely to adopt a wait-and-see strategy, further amplifying the importance of technical signals.
Outlook for the future
Bullish outlook: Analysts believe that if the geopolitical situation continues to heat up or the Federal Reserve releases dovish signals, gold is expected to break through the $3,450 resistance area and challenge the previous high of $3,499.83; by then, the momentum of ETF holdings and safe-haven inflows will jointly promote a new round of bullish market.
Short-term outlook: Analysts believe that if the FOMC meeting results are hawkish or Powell sends a signal that he will not cut interest rates, coupled with the easing of risk aversion in the market, gold may fall back to the key support area of $3,330. If it loses this position, it will form a trend reversal signal, with the target down to the lower Bollinger track of $3,194, or even lower.
Overall, the analysis believes that gold is still running in an upward trend structure, but volatility is compressed, and the short-term direction needs to wait for clear signals from the Fed meeting. Traders are closely watching the changes in the Fed's monetary policy and geopolitical situation, while being alert to the risks of "false breakthroughs" and sharp pullbacks. XAUUSD GOLD XAUUSD XAUUSD GOLD
Fundamentals
Tensions in the Middle East have heated up again. According to Reuters, Israel's air strikes on Iran's state-run TV station, Iran's threats to launch the most violent missile attack in history, and the fire of three oil tankers near the Strait of Hormuz have caused market concerns about the escalation of geopolitical conflicts. US President Trump left the G7 summit early and convened a national security meeting, which increased market risk aversion.
At the same time, ETF holdings increased significantly. Data showed that ETFs increased their holdings of gold by 136,000 ounces on the previous trading day, and the net purchase volume has reached 6 million ounces this year, reflecting that funds still have strong confidence in the future of gold. SPDR Gold ETF even recorded a single-day net inflow of $285 million last Friday, the largest in weeks.
In terms of the US macroeconomics, the market generally expects the Fed to keep interest rates unchanged this week, but the focus is on Powell's speech and changes in the dot plot. As expectations of further rate cuts in 2025 heat up, the US dollar is still under pressure close to a three-year low, and analysts believe that this will form a structural support for gold in the medium term.
Technical aspects:
The gold daily candlestick chart shows that the current trend is in a typical "rising wedge" pattern. Prices have been steadily rising along an upward trend line this year, while the upper side is suppressed by strong resistance in the 3450-3500 area. The current market is in a wait-and-see state.
There are obvious signs of Bollinger Bands closing, with the upper Bollinger track at $3440.63, the middle Bollinger track at $3317.51, and the lower track has moved up to around $3194.38, reflecting that the market is brewing a breakthrough. The current price is basically running between the upper and middle Bollinger tracks, indicating that it is still in a bullish structure, but once it falls below the middle Bollinger track or the lower edge of the wedge (about $3,330), it may trigger accelerated downside risks. The RSI indicator remains at 55.79, neutral to strong, and has not entered the overbought area.
Comprehensively judged, the analysis believes that the short-term trend is in consolidation, and be alert to the risk of technical reversal. If the support of $3,330 is lost, further downside space will be opened; on the upside, it needs to break through the pressure range of $3,450 before trying the previous high of $3,499.83.
Market sentiment observation
The current gold market sentiment is in a "highly sensitive" stage. On the one hand, risk aversion once pushed gold to rebound rapidly, reflecting that the market has a very high pricing sensitivity to geopolitical risks; on the other hand, traders are still uncertain about the outlook for the Fed's policy, and the expectation that interest rates will remain unchanged has been fully priced in, but there are large differences in the future path of interest rate cuts.
The weak rebound of the US dollar shows that the market does not fully agree with the logic of "hawkish stability maintenance". This contradictory sentiment has caused gold to fluctuate at a high level and has not yet formed a trend breakthrough. The continued increase in ETF holdings provides substantial buying support for gold, which constitutes the optimistic support of the "underlying logic".
In addition, the market is still waiting for the FOMC meeting to release new signals. This "uncertain outlook" constitutes a typical "cautious optimism" market psychology. Traders are more likely to adopt a wait-and-see strategy, further amplifying the importance of technical signals.
Outlook for the future
Bullish outlook: Analysts believe that if the geopolitical situation continues to heat up or the Federal Reserve releases dovish signals, gold is expected to break through the $3,450 resistance area and challenge the previous high of $3,499.83; by then, the momentum of ETF holdings and safe-haven inflows will jointly promote a new round of bullish market.
Short-term outlook: Analysts believe that if the FOMC meeting results are hawkish or Powell sends a signal that he will not cut interest rates, coupled with the easing of risk aversion in the market, gold may fall back to the key support area of $3,330. If it loses this position, it will form a trend reversal signal, with the target down to the lower Bollinger track of $3,194, or even lower.
Overall, the analysis believes that gold is still running in an upward trend structure, but volatility is compressed, and the short-term direction needs to wait for clear signals from the Fed meeting. Traders are closely watching the changes in the Fed's monetary policy and geopolitical situation, while being alert to the risks of "false breakthroughs" and sharp pullbacks.
Senior market strategy analyst | CFA® charter holder | Builder of a profit system with millions of members. "Don't be a market forecaster, just a profit engineer. If you want to join, please click 🚀🚀🚀:t.me/EagleEyePrecisionAnalysis
Disclaimer
The information and publications are not meant to be, and do not constitute, financial, investment, trading, or other types of advice or recommendations supplied or endorsed by TradingView. Read more in the Terms of Use.