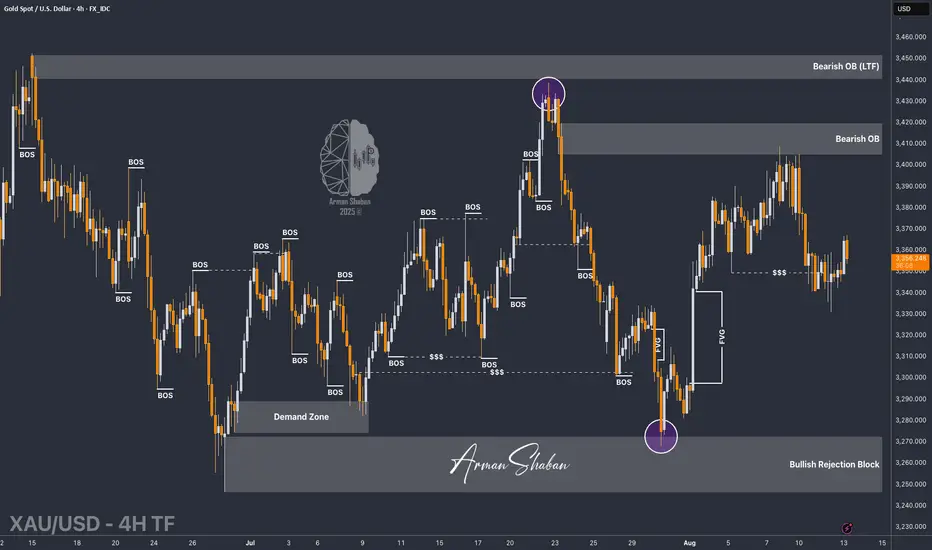
By analyzing the #Gold chart on the 4-hour timeframe, we can see that after correcting down to the $3331 demand zone, price faced strong buying pressure and is now trading around $3357.
If gold manages to hold below $3367, we could expect a stronger drop, with downside targets at $3342, $3331, and $3323. This scenario will only fail if price holds above $3350, pushes past $3367, and closes above it — in that case, gold may rally back toward levels above $3390.
This analysis will be updated soon — don’t forget to show some support, friends!
Please support me with your likes and comments to motivate me to share more analysis with you and share your opinion about the possible trend of this chart with me !
Best Regards , Arman Shaban
⚜️ Free Telegram Channel : t.me/PriceAction_ICT
⚜️ JOIN THE VIP : t.me/PriceAction_ICT/5946
⚜️ Contact Me : t.me/ArmanShabanTrading
💥Join BitMart Exchange – Ultra Low Fees : bitmart.com/invite/c5JVJK/en-US
⚜️ JOIN THE VIP : t.me/PriceAction_ICT/5946
⚜️ Contact Me : t.me/ArmanShabanTrading
💥Join BitMart Exchange – Ultra Low Fees : bitmart.com/invite/c5JVJK/en-US
Related publications
Disclaimer
The information and publications are not meant to be, and do not constitute, financial, investment, trading, or other types of advice or recommendations supplied or endorsed by TradingView. Read more in the Terms of Use.