Fundamentals First: Why is Gold Falling While DXY is Too?
Normally, gold and the U.S. dollar share an inverse relationship (which means, when DXY weakens, gold rises). But recently, this correlation has broken down, and that divergence is a loud macro signal.
What’s Happening:
My Perspective:
This is the first clear signal in months that geopolitical hedging may have peaked. When gold decouples from its safe-haven narrative despite macro uncertainty, that often precedes a structural rotation phase, especially if institutional flows favor equities.
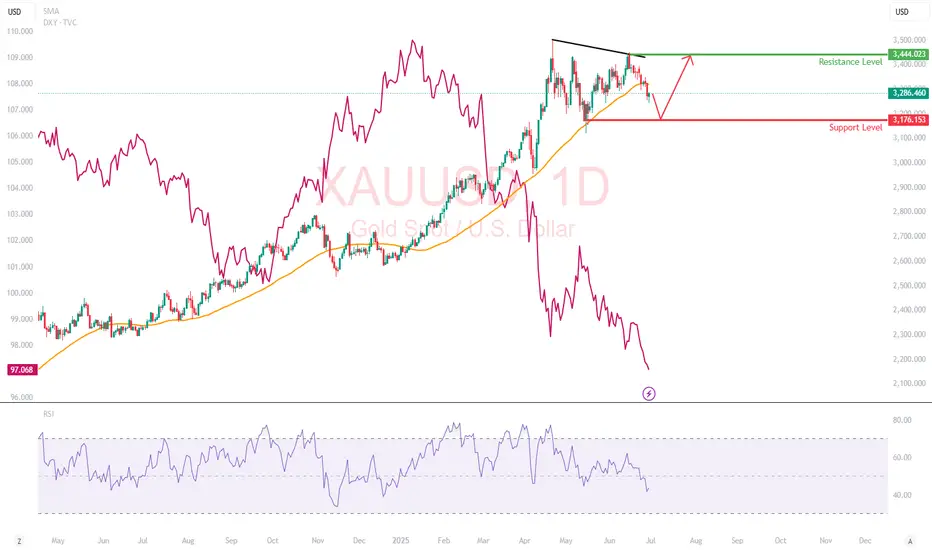
Technical Breakdown
Gold has broken below its 50-day SMA at $3,322 and is trading in the lower third of its 3-month range. While the daily candles show increasing selling pressure, especially on lower highs (a sign of weakening bullish momentum)
RSI: Falling toward 40, with no bullish divergence yet.
Support Level: $3,176: Previous swing low
Resistance Level: $3,444: previous swing high
What This Move Might Be Telling Us
When gold sells off on dollar weakness and geopolitical calm, the market isn’t just relaxing. It is rotating. The de-grossing of gold-heavy hedges: Some hedge funds may be taking profit on gold-heavy exposure from Q1’s rally.
Rise of risk appetite despite cracks: Markets are forward-pricing trade peace and earnings resilience, possibly too early. Gold might not be in trouble, but it’s on the bench. Unless something reignites fear (e.g., Fed policy mistake, Middle East flashpoint, or economic shock), capital may stay elsewhere.
Normally, gold and the U.S. dollar share an inverse relationship (which means, when DXY weakens, gold rises). But recently, this correlation has broken down, and that divergence is a loud macro signal.
What’s Happening:
- Trade Deal Optimism:
- Iran-Israel Ceasefire:
- Real Yields Still Elevated:
My Perspective:
This is the first clear signal in months that geopolitical hedging may have peaked. When gold decouples from its safe-haven narrative despite macro uncertainty, that often precedes a structural rotation phase, especially if institutional flows favor equities.
Technical Breakdown
Gold has broken below its 50-day SMA at $3,322 and is trading in the lower third of its 3-month range. While the daily candles show increasing selling pressure, especially on lower highs (a sign of weakening bullish momentum)
RSI: Falling toward 40, with no bullish divergence yet.
Support Level: $3,176: Previous swing low
Resistance Level: $3,444: previous swing high
What This Move Might Be Telling Us
When gold sells off on dollar weakness and geopolitical calm, the market isn’t just relaxing. It is rotating. The de-grossing of gold-heavy hedges: Some hedge funds may be taking profit on gold-heavy exposure from Q1’s rally.
Rise of risk appetite despite cracks: Markets are forward-pricing trade peace and earnings resilience, possibly too early. Gold might not be in trouble, but it’s on the bench. Unless something reignites fear (e.g., Fed policy mistake, Middle East flashpoint, or economic shock), capital may stay elsewhere.
Join my mailing list jindaotai.com/joinme
Disclaimer
The information and publications are not meant to be, and do not constitute, financial, investment, trading, or other types of advice or recommendations supplied or endorsed by TradingView. Read more in the Terms of Use.
Join my mailing list jindaotai.com/joinme
Disclaimer
The information and publications are not meant to be, and do not constitute, financial, investment, trading, or other types of advice or recommendations supplied or endorsed by TradingView. Read more in the Terms of Use.