If you’ve ever wondered how professional traders predict where price might pull back before continuing... the secret lies in Fibonacci Retracement.
In this post, you’ll learn:
🧠 What Is Fibonacci Retracement?:
Fibonacci Retracement is a technical analysis tool that helps traders identify potential support or resistance zones where price is likely to pause or reverse during a pullback.
It’s based on a mathematical sequence called the Fibonacci Sequence, found everywhere in nature — from galaxies to sunflowers — and yes, even in the markets.
The Fibonacci sequence is a series of numbers where each number is the sum of the two preceding ones, starting with 0 and 1. The sequence typically begins with 0, 1, 1, 2, 3, 5, 8, 13, and so on. This pattern can be expressed as a formula: F(n) = F(n-1) + F(n-2), where F(n) is the nth Fibonacci number.
The key Fibonacci levels traders use are:
These levels represent percentages of a previous price move, and they give us reference points for where price might pull back before resuming its trend and where we can anticipate price to move before showing support or resistance to the trend you are following.
💡Breakdown of Each Fib Level:
💎 0.236 (23.6%) – Shallow Pullback
What it indicates:
Weak retracement, often signals strong trend momentum.
Buyers/sellers are aggressively holding the trend.
Best action:
Aggressive entry zone for continuation traders.
Look for momentum signals (break of minor structure, bullish/bearish candles). Stay out of the market until you see more confirmation.
💎 0.382 (38.2%) – First Strong Area of Interest
What it indicates:
Healthy pullback in a trending market.
Seen as a key area for trend followers to step in.
Best action:
Look for entry confirmation: bullish/bearish engulfing, pin bars, Elliott Waves, or break/retest setups.
Ideal for setting up trend continuation trades.
Stop Loss 0.618 Level
💎 0.500 (50.0%) – Neutral Ground
What it indicates:
Often marks the midpoint of a significant price move.
Market is undecided, can go either way.
Best action:
Wait for additional confirmation before entering.
Combine with support/resistance or a confluence zone.
Useful for re-entry on strong trends with good risk/reward.
Stop Loss 1.1 Fib Levels
💎 0.618 (61.8%) – The “Golden Ratio”
What it indicates:
Deep pullback, often seen as the last line of defense before trend reversal.
High-probability area for big players to enter or add to positions.
Best action:
Look for strong reversal patterns (double bottoms/tops, engulfing candles).
Excellent area for entering swing trades with tight risk and high reward.
Use confluence (structure zones, moving averages, psychological levels, Elliott Waves).
Wait for close above or below depending on the momentum of the market.
Stop Loss 1.1 Fib Level
💎 0.786 (78.6%) – Deep Correction Zone
What it indicates:
Very deep retracement. Often a final “trap” zone before price reverses.
Risk of trend failure is higher.
Best action:
Only trade if there's strong reversal evidence.
Use smaller position size or avoid unless other confluences are aligned.
Can act as an entry for counter-trend trades in weaker markets.
Stop Loss around 1.1 and 1.2 Fib Levels
⏱️Best Timeframe to Use Fibs for Day Traders and Swing Traders:
Day traders, focused on capturing short-term price movements and making quick decisions within a single day, typically utilize shorter timeframes for Fibonacci retracement analysis, such as 15-minute through hourly charts.
They may also use tighter Fibonacci levels (like 23.6%, 38.2%, and 50%) to identify more frequent signals and exploit short-term fluctuations.
Combining Fibonacci levels with other indicators such as moving averages, RSI, or MACD, and focusing on shorter timeframes (e.g., 5-minute or 15-minute charts) can enhance signal confirmation for day traders.
However, relying on very short timeframes for Fibonacci can lead to less reliable retracement levels due to increased volatility and potential for false signals.
Swing traders aim to capture intermediate trends, which necessitates giving trades more room to fluctuate over several days or weeks.
They typically prefer utilizing broader Fibonacci levels (like 38.2%, 50%, and 61.8%) to identify significant retracement points for entering and exiting trades.
Swing traders often focus on 4-hour and daily charts for their analysis, and may even consult weekly charts for a broader market perspective.
🎯 Why Does Fibonacci Work?:
Fibonacci levels work because of:
🛠 How to Draw Fibonacci Retracement (Step-by-Step):
Let’s say you want to trade XAU/USD (Gold), and price just had a strong bullish run.
✏️ Follow These Steps:
🔁 For bearish moves, draw from high to low. (I will show a bearish example later)
Now let’s throw some examples and pictures into play to get a better understanding.
📈 XAU/USD BULLISH Example:
1.First we Identify the direction of the market:

2.Now we set our fibs by looking for confirmations to get possible entry point:

Lets zoom in a bit:

Now that we have a break of the trendline we wait for confirmation and look for confluence:

Now we set our fibs from the last low to the last high:

This will act as our entry point for the trade.
3. Now we can look for our stop loss and take profit levels:
Re-Entry Point Using Elliott Waves as Confluence Example:
This is an example of how I used Elliott Waves to enter the trade again from the prior entry point. If you don’t know what Elliott Waves are I will link my other educational post so you can read up on it and have a better understanding my explanation to follow.
After seeing all of our prior confirmations I am now confident that our trend is still strongly bullish so I will mark my Waves and look for an entry point.

As we can see price dipped into the 0.38-0.5 Fib level and rejected it nicely which is also in confluence with the Elliott Wave Theory for the creation of wave 5 which is the last impulse leg before correction.
🔻 In a downtrend:
Same steps, but reverse the direction — draw from high to low and look to short the pullback.
XAU/USD Example:

As you can see the same basic principles applied for bearish movement as well.
⚠️ Pro Tips for Accuracy:
✅ Always use Fib in confluence with:
Market structure (higher highs/lows or lower highs/lows)
Key support/resistance zones
Volume or momentum indicators
Candle Patterns
Elliott Waves, etc.
❌ Don’t trade Fib levels blindly — they are zones, not guarantees.
📊 Use higher timeframes for cleaner levels (4H, Daily)
💡 Final Thought
Fibonacci retracement doesn’t predict the future — it reveals probability zones where price is likely to react.
When combined with structure and confirmation, it becomes one of the most reliable tools for new and experienced traders alike.
🔥 Drop a comment if this helped — or if you want a Part 2 where I break down Fibonacci Extensions and how to use them for take-profit targets.
💬 Tag or share with a beginner who needs to see this!
In this post, you’ll learn:
- What Fibonacci retracement is
- Why it works
- How to use it on your charts (step-by-step)
- Pro tips to increase accuracy in the market
🧠 What Is Fibonacci Retracement?:
Fibonacci Retracement is a technical analysis tool that helps traders identify potential support or resistance zones where price is likely to pause or reverse during a pullback.
It’s based on a mathematical sequence called the Fibonacci Sequence, found everywhere in nature — from galaxies to sunflowers — and yes, even in the markets.
The Fibonacci sequence is a series of numbers where each number is the sum of the two preceding ones, starting with 0 and 1. The sequence typically begins with 0, 1, 1, 2, 3, 5, 8, 13, and so on. This pattern can be expressed as a formula: F(n) = F(n-1) + F(n-2), where F(n) is the nth Fibonacci number.
The key Fibonacci levels traders use are:
- 23.6%
- 38.2%
- 50%
- 61.8%
- 78.6%
These levels represent percentages of a previous price move, and they give us reference points for where price might pull back before resuming its trend and where we can anticipate price to move before showing support or resistance to the trend you are following.
💡Breakdown of Each Fib Level:
💎 0.236 (23.6%) – Shallow Pullback
What it indicates:
Weak retracement, often signals strong trend momentum.
Buyers/sellers are aggressively holding the trend.
Best action:
Aggressive entry zone for continuation traders.
Look for momentum signals (break of minor structure, bullish/bearish candles). Stay out of the market until you see more confirmation.
💎 0.382 (38.2%) – First Strong Area of Interest
What it indicates:
Healthy pullback in a trending market.
Seen as a key area for trend followers to step in.
Best action:
Look for entry confirmation: bullish/bearish engulfing, pin bars, Elliott Waves, or break/retest setups.
Ideal for setting up trend continuation trades.
Stop Loss 0.618 Level
💎 0.500 (50.0%) – Neutral Ground
What it indicates:
Often marks the midpoint of a significant price move.
Market is undecided, can go either way.
Best action:
Wait for additional confirmation before entering.
Combine with support/resistance or a confluence zone.
Useful for re-entry on strong trends with good risk/reward.
Stop Loss 1.1 Fib Levels
💎 0.618 (61.8%) – The “Golden Ratio”
What it indicates:
Deep pullback, often seen as the last line of defense before trend reversal.
High-probability area for big players to enter or add to positions.
Best action:
Look for strong reversal patterns (double bottoms/tops, engulfing candles).
Excellent area for entering swing trades with tight risk and high reward.
Use confluence (structure zones, moving averages, psychological levels, Elliott Waves).
Wait for close above or below depending on the momentum of the market.
Stop Loss 1.1 Fib Level
💎 0.786 (78.6%) – Deep Correction Zone
What it indicates:
Very deep retracement. Often a final “trap” zone before price reverses.
Risk of trend failure is higher.
Best action:
Only trade if there's strong reversal evidence.
Use smaller position size or avoid unless other confluences are aligned.
Can act as an entry for counter-trend trades in weaker markets.
Stop Loss around 1.1 and 1.2 Fib Levels
⏱️Best Timeframe to Use Fibs for Day Traders and Swing Traders:
Day traders, focused on capturing short-term price movements and making quick decisions within a single day, typically utilize shorter timeframes for Fibonacci retracement analysis, such as 15-minute through hourly charts.
They may also use tighter Fibonacci levels (like 23.6%, 38.2%, and 50%) to identify more frequent signals and exploit short-term fluctuations.
Combining Fibonacci levels with other indicators such as moving averages, RSI, or MACD, and focusing on shorter timeframes (e.g., 5-minute or 15-minute charts) can enhance signal confirmation for day traders.
However, relying on very short timeframes for Fibonacci can lead to less reliable retracement levels due to increased volatility and potential for false signals.
Swing traders aim to capture intermediate trends, which necessitates giving trades more room to fluctuate over several days or weeks.
They typically prefer utilizing broader Fibonacci levels (like 38.2%, 50%, and 61.8%) to identify significant retracement points for entering and exiting trades.
Swing traders often focus on 4-hour and daily charts for their analysis, and may even consult weekly charts for a broader market perspective.
🎯 Why Does Fibonacci Work?:
Fibonacci levels work because of:
- Mass psychology – many traders use them
- Natural rhythm – markets move in waves, not straight lines
- Institutional footprint – smart money often scales in around key retracement zones
- It's not magic — it's structure, and it's surprisingly reliable when used correctly.
🛠 How to Draw Fibonacci Retracement (Step-by-Step):
Let’s say you want to trade XAU/USD (Gold), and price just had a strong bullish run.
✏️ Follow These Steps:
- Identify the swing low (start of move)
- Identify the swing high (end of move)
- Use your Fibonacci tool to draw from low to high (for a bullish move)
- The tool will automatically mark levels like 38.2%, 50%, 61.8%, etc.
- These levels act as pullback zones, and your job is to look for entry confirmation around them.
🔁 For bearish moves, draw from high to low. (I will show a bearish example later)
Now let’s throw some examples and pictures into play to get a better understanding.
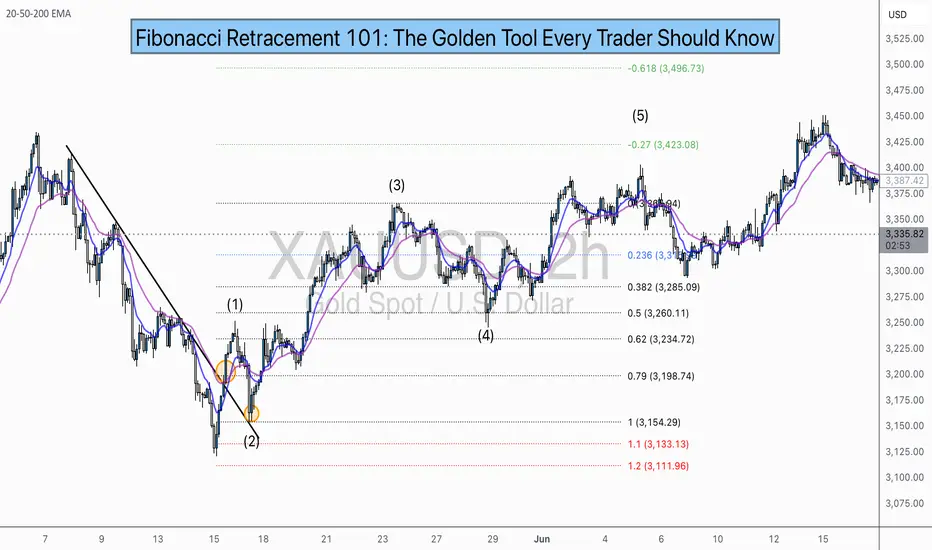
📈 XAU/USD BULLISH Example:
1.First we Identify the direction of the market:
2.Now we set our fibs by looking for confirmations to get possible entry point:
Lets zoom in a bit:
Now that we have a break of the trendline we wait for confirmation and look for confluence:
Now we set our fibs from the last low to the last high:
This will act as our entry point for the trade.
3. Now we can look for our stop loss and take profit levels:
- Stop Loss:
For the stop loss I like to use the fib levels 1.1 and 1.2 when I make an entry based upon the 0.618 level. These levels to me typically indicate that the trade idea is invalid once crossed because it will usually violate the prior confirmations
- Take Profit:
For the take profit I like to use the Fib levels 0.236, 0, -0.27, and -0.618. This is based upon your personal risk tolerance and overall analysis. You can use 0.236 and 0 level as areas to take partial profits.
Re-Entry Point Using Elliott Waves as Confluence Example:
This is an example of how I used Elliott Waves to enter the trade again from the prior entry point. If you don’t know what Elliott Waves are I will link my other educational post so you can read up on it and have a better understanding my explanation to follow.
After seeing all of our prior confirmations I am now confident that our trend is still strongly bullish so I will mark my Waves and look for an entry point.
As we can see price dipped into the 0.38-0.5 Fib level and rejected it nicely which is also in confluence with the Elliott Wave Theory for the creation of wave 5 which is the last impulse leg before correction.
🔻 In a downtrend:
Same steps, but reverse the direction — draw from high to low and look to short the pullback.
XAU/USD Example:
As you can see the same basic principles applied for bearish movement as well.
⚠️ Pro Tips for Accuracy:
✅ Always use Fib in confluence with:
Market structure (higher highs/lows or lower highs/lows)
Key support/resistance zones
Volume or momentum indicators
Candle Patterns
Elliott Waves, etc.
❌ Don’t trade Fib levels blindly — they are zones, not guarantees.
📊 Use higher timeframes for cleaner levels (4H, Daily)
💡 Final Thought
Fibonacci retracement doesn’t predict the future — it reveals probability zones where price is likely to react.
When combined with structure and confirmation, it becomes one of the most reliable tools for new and experienced traders alike.
🔥 Drop a comment if this helped — or if you want a Part 2 where I break down Fibonacci Extensions and how to use them for take-profit targets.
💬 Tag or share with a beginner who needs to see this!
💎 FREE FOREX and CRYPTO Signals: t.me/WWInvestmentsFree
🌐 Website: taplink.cc/wrightwayinvestments
🌐 Website: taplink.cc/wrightwayinvestments
Related publications
Disclaimer
The information and publications are not meant to be, and do not constitute, financial, investment, trading, or other types of advice or recommendations supplied or endorsed by TradingView. Read more in the Terms of Use.