XAUUSD Smart Money Technical Analysis – Bullish Potential from Strong Support
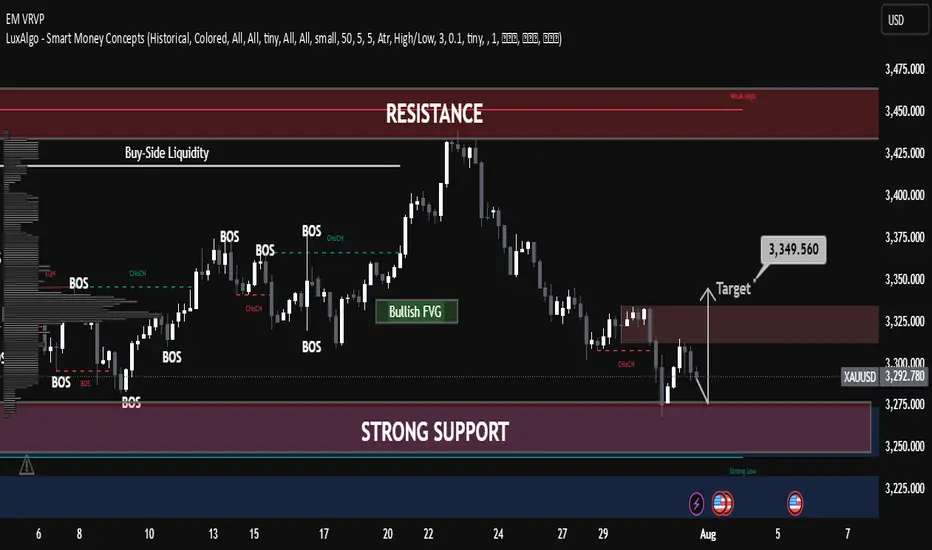
Gold (XAUUSD) is currently trading around $3,291.780, showing a potential bullish reversal setup from the strong support zone after a clear liquidity sweep and market structure shifts.
🔍 Key Technical Highlights:
✅ Strong Support Zone (Demand)
Price is reacting from a major demand zone (Strong Low) between $3,275 – $3,225, a level that previously triggered bullish rallies.
Multiple Breaks of Structure (BOS) and CHoCH indicate previous bullish control and a possible re-accumulation phase.
✅ CHoCH Near Support
A recent Change of Character (CHoCH) around the support area shows the first signs of smart money accumulation.
Liquidity below recent lows has been swept, triggering possible bullish intent.
✅ Bullish FVG (Fair Value Gap)
A clear Bullish FVG remains unmitigated around the mid-range, offering target confluence at $3,349.560.
Price may aim to rebalance inefficiency and fill the FVG as part of the bullish move.
✅ Resistance Zone Above
The resistance area near $3,325 – $3,350 acts as a short-term target for long positions.
Further resistance lies at the Buy-Side Liquidity & Weak High zone around $3,450 if momentum sustains.
🧠 Smart Money Concept Interpretation:
Liquidity Grab: Price dipped into strong demand to collect sell-side liquidity before potential reversal.
CHoCH + BOS Alignment: Indicates the market may now transition into a bullish phase.
FVG as Magnet: Price is drawn toward unfilled value zones—ideal for bullish target projection.
🎯 Trade Idea (Educational Purposes Only):
Bias: Bullish
Entry: Around current zone ($3,290)
Target: $3,349.560 (FVG zone)
Invalidation/SL: Below strong low (~$3,225)
Trade closed: target reached
Gold (XAUUSD) successfully hit our projected target after showing a strong bullish reaction from the key demand zone. The price respected the support level, forming a solid bullish structure with higher highs and higher lows.Market Analyst | XAU/USD Focused
Educational Content & Technical Breakdowns
Premium VIP Signals & Market Insights
Forex Mentorship & Live trades & strategies shared daily
Join our Telegram t.me/Mentor_Michael033
Educational Content & Technical Breakdowns
Premium VIP Signals & Market Insights
Forex Mentorship & Live trades & strategies shared daily
Join our Telegram t.me/Mentor_Michael033
Disclaimer
The information and publications are not meant to be, and do not constitute, financial, investment, trading, or other types of advice or recommendations supplied or endorsed by TradingView. Read more in the Terms of Use.
Market Analyst | XAU/USD Focused
Educational Content & Technical Breakdowns
Premium VIP Signals & Market Insights
Forex Mentorship & Live trades & strategies shared daily
Join our Telegram t.me/Mentor_Michael033
Educational Content & Technical Breakdowns
Premium VIP Signals & Market Insights
Forex Mentorship & Live trades & strategies shared daily
Join our Telegram t.me/Mentor_Michael033
Disclaimer
The information and publications are not meant to be, and do not constitute, financial, investment, trading, or other types of advice or recommendations supplied or endorsed by TradingView. Read more in the Terms of Use.